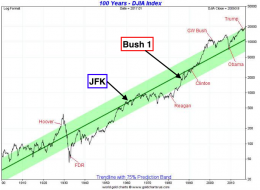
User: Tim Knight: Historical Example
101-yrs-7.5-trendline-5-13-20.png (1280×720)

2
the best bull market.1573743376642.png (765×445)
As of today, this is the largest, and longest, bull market in human history.
2
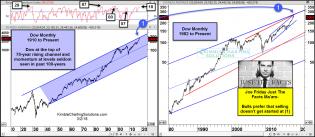
2019 vs 2007 morgan stanley.png (859×1069)
1
How-Much-American-Debt-Bubble.png (953×446)
img-12-1.png (706×670)
2
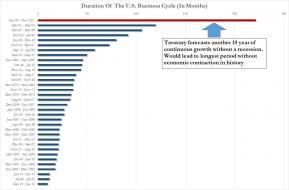
business cycle length record_1.jpg (1280×838)
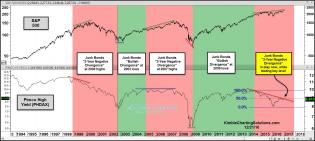
We are in the longest business expansion in history
NY-Fed-Prob-of-Recession-Chart.jpg (1114×551)
1
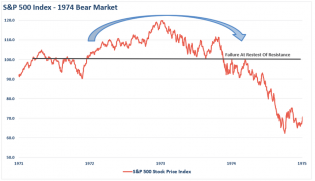
SP500-1974-Bear-Top-011119.png (890×512)
Fall, retrace, then plunge: 1974
DuKc6APXgAA3pXB.jpg:large (1715×2043)
Doom-Porn from Atilla
2
spx-reapting-2000-and-20007-pattern-testing-key-support-oct-19.j...
2
2018-10-03_9-11-22.jpg (890×469)
3
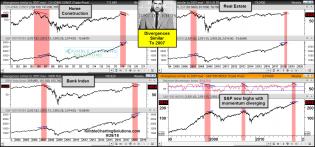
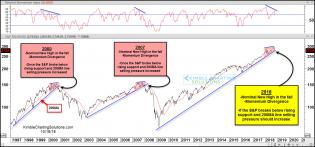
joe-friday-divergences-similar-to-2007-sept-28.jpg (1567×735)
2007 and 2018
2018-08-21-bull-market-fallback.png (890×628)
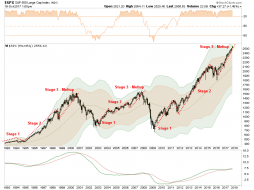
Longest bull run in history
2
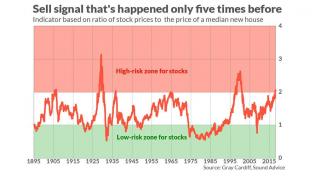
MW-GO608_sell_s_20180820153307_ZH.jpg (890×501)
The Stock Market's Latest Sell Signal Has Happened Only 5 Previous Times Since 1895
bull 1.jpg (890×369)
Longest bull market in human history.
Fuck. Me.
1
MW-GO007_Leutho_20180808145701_NS.jpg (890×679)
2018-06-21_12-27-25.jpg (890×452)
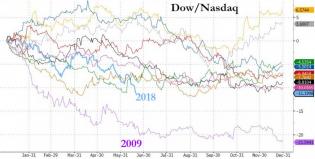
This is the worst year-to-date divergence between Dow/Nasdaq since 2009...
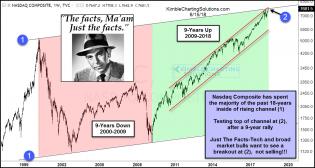
joe-friday-nas-comp-9-year-pattern-jun-15.jpg (1237×661)
Tech stocks analog
2
2018-06-05_13-57-32.jpg (890×639)
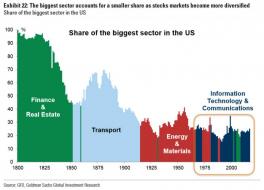
Sector dominance in the market
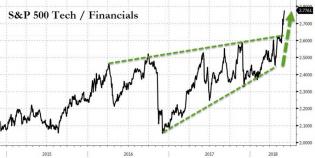
2018-06-05_12-32-34_0.jpg (890×447)
The only time the tech sector has been more valuable than this, relative to the financials, was at the very peak o...
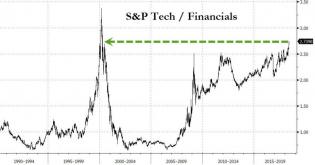
2018-06-01_12-57-21.jpg (890×468)
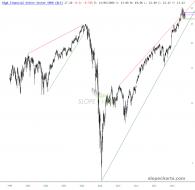
slopechart_XLF.jpg
One of my favorite analogs of all time.
ecommerce bubble.jpg (890×496)
Comparing the present bubble to past ones
1
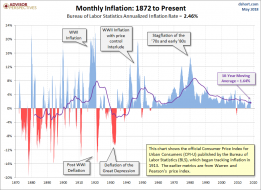
Inflation Since 1872
Monthly inflation over centuries
1
2018-03-28_10-58-41.jpg (890×455)
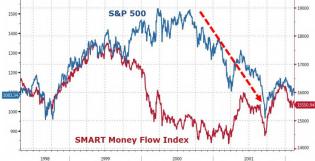
The last time SMART money and the market diverged this much did not end well for stocks...
1
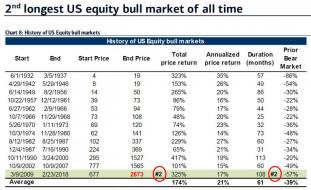
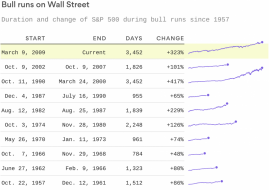
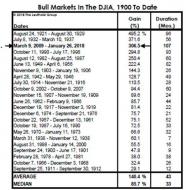
longest bull markets.jpg (890×543)
We are in the second longest bull market in history
1
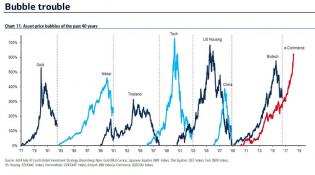
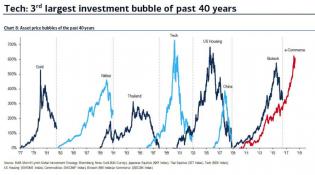
bubble trouble 2.jpg (890×497)
Asset bubbles over the past 40 years
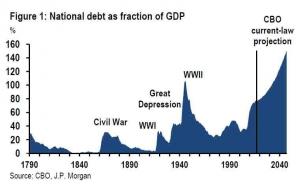
jpm debt cbo forecast.jpg (763×481)
Debt/GDP ratio (and this is based on a hugely OPTIMISTIC forecast by the geniuses in the Fed Govt)
2
Bull-market-DJIA.jpg (554×565)
Biggest bull markets of all time
2
joe-friday-dow-at-top-of-70-year-channel-momentum-seldom-seen-march...
Similarities to 1929, 1987, 2000 & 2007 in play
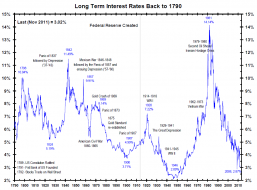
Long-Term.png (1078×796)
Interest rate history
TSY tax forecast.jpg (1299×854)
Mnuchin has fallen in line behind his boss and repeatedly asserted that the US would make up for lost tax revenue...
market rates before crash.jpg (862×444)
"Every market crash has been preceded by Fed tightening."
3
SP500-1999-2007-2016-Comparision-021818.png (1100×688)
2
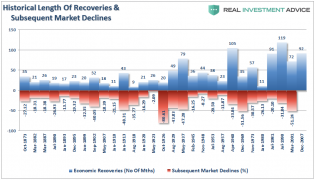
Recessions-Recovery-021918.png (900×511)
sc-1108.png (990×788)
1929 Throwover Top
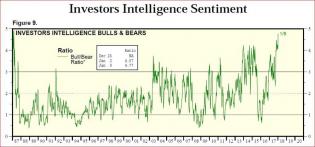
II bulls.jpg (890×416)
Stock Market Optimism Hits Highest Level Since Crash Of 1987
2
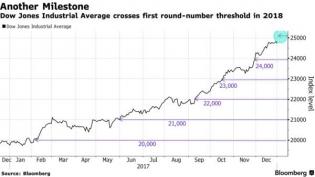
dj 25000.jpg (600×338)
Big Round Numbers and the Dow
5-1.jpg (759×491)
As it stands it’s been around 80 days now there hasn’t been an either 1% up or down move on the $SPX. 5% pullback...
2
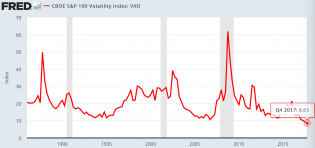
VXO.png (1630×766)
However in this case markets have been subject to unprecedented volatility compression. Never has a year or quarte...
assets.jpg (1490×980)
Assets to GDP - yet another extreme never before seen in the history of the universe
1
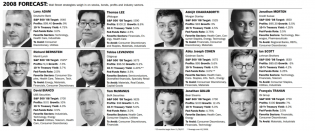
2007-1.png (1608×672)
The brilliant 2008 forecasts from the "experts", including the hideously ugly Abby Joseph Cohen.
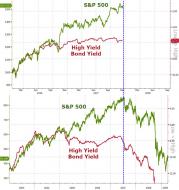
20171215_HY3.jpg (1019×1080)
This is "unusual... Must Watch"
1
20171213_seas6.png (768×893)
Fascinating
20171201_accel2.png (960×563)
The Global FInancial Crisis bubble
1
20171130_never.jpg (1161×586)
Unless the world comes to a very serious end overnight, global equity markets are about to do something they have...
2
Contra Corner » Chart of the Day: Look Out Below!
AAPL in context_1
A surprising perspective
20171115_EOD8.jpg (959×1008)
A beautiful analog...........
1
20171110_eod10.jpg (965×509)
first 12 month period in the history of the S&P 500 without a 3% drawdown. The VIX is also the lowest on record us...
2
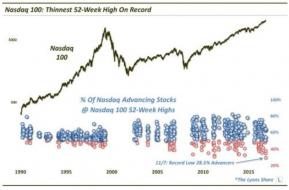
20171108_nasd.jpg (755×495)
No 52-week high in the Nasdaq 100 has ever been accompanied by as few advancing stocks as today’s.
1
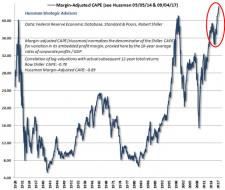
20171106_huss3.jpg (668×564)
On this measure, market valuations are now more extreme than at any point in history, including the 1929 and 2000...
1
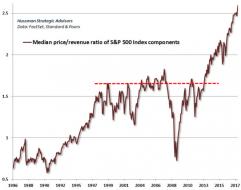
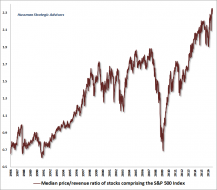
20171106_huss1.jpg (663×521)
The chart below shows the median price/revenue ratio of S&P 500 component stocks, which set yet another record hig...
1
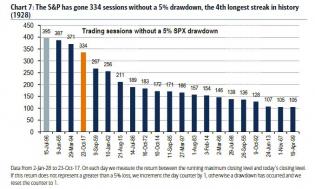
bofa vol 1.jpg (678×408)
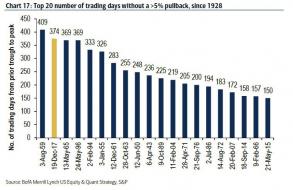
We have now recorded 334 days without a 5% or more pullback (and 335 after today's close), the fourth longest peri...
1
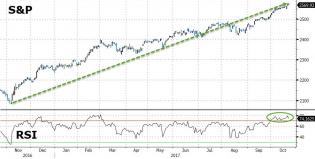
20171023_EOD2.jpg (961×486)
It has now been 242 days since the US equity market dipped by 3% or more... That has never, ever, happened before..
2
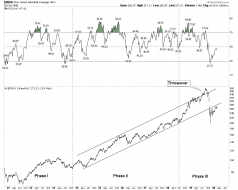
3-Phases-Bull-Market-101917.png (900×673)
As I have shown previously, these late stage “melt-ups” are not uncommon. In fact, as shown below, it is somethin...
2
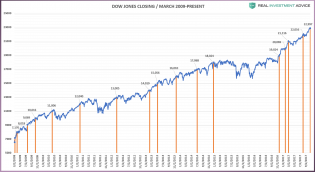
Dow-1000point-Closes-2009-Present.png (1758×960)
The chart below shows the 1000-point milestones of the Dow going back to 2009. After a long break between 18,000 a...
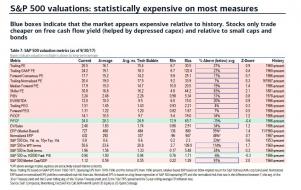
valuation 18 out of 20 bofa.jpg (956×603)
The S&P 500 Is Now Overvalued On 18 Of 20 Metrics
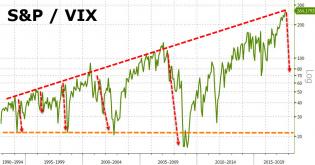
20171007_stock.jpg (962×504)
As StockBoardAsset shows on the 24-year monthly ratio chart below, bulls have pushed the S&P:VIX price into uncharted...
1
20170816_best4.png (1175×619)
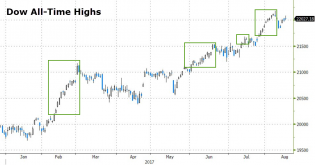
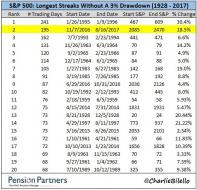
The Dow has hit 31 all-time highs in 2017 and has done so with no more than a 3% pullback.
2
20170816_best1.jpg (508×489)
The S&P 500 has not seen a drawdown of more than 3% since the election last November. As PensionPartners' Charlie...
20170811_EOD12.jpg (1182×617)
My favorite analog right now...........
4
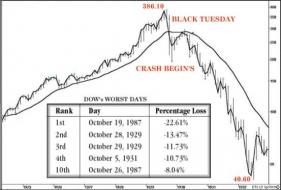
Logarithmic-Chart-Stock-Market-Crash-1929.jpg (553×373)
Crash of 1929 - this is what I keep hidden under my mattress.
2

20170714_eod6.jpg (1185×614)
The stock market is near peak euphoria here (tracked by the ratio of Fwd P/E to VIX)...
4
Investor-Psychology-100k-062417.png (900×541)
A long view of the psychology of the markets
1
SP500-Comparison-061617.png (1102×687)
Historically speaking, such levels of exuberance have tended to have poor outcomes for investors who did not reali...
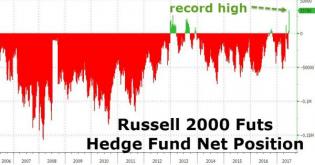
Hedge Funds Have Never Been This Bullish About Small-Cap Stocks...
Over 57,000 Russell 2000 e-mini contract longs were added in the last two weeks - the most since July 2008 - leavi...
1
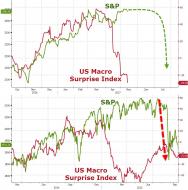
20170615_EOD6.jpg (960×486)
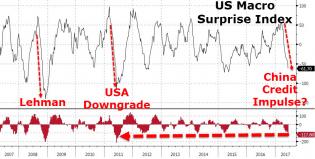
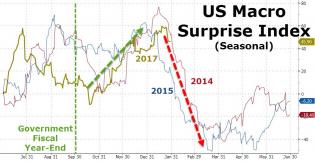
Notably, the US Macro Surprise Index has dropped for 13 straight weeks (since The Fed hiked in March) - this is th...
1
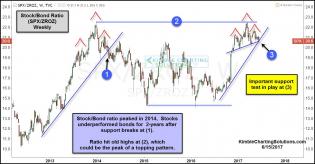
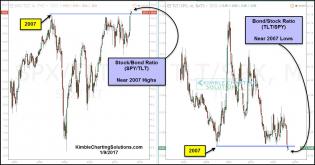
stock-bond-ratio-could-be-creating-double-top-and-hands-pattern-jun...
Below looks at the Stock/Bond ratio (SPX/ZROZ), using the two assets from above. The ratio in our humble opinion,...
20170512_EOD3.jpg (965×971)
The last time US Macro and stocks decoupled like this was in mid 2015 and did not end well for stocks...
5
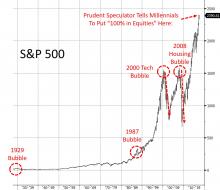
2017.05.03 - Prudent Speculator 2.jpg (1254×1080)
'Reputable' Investing Newsletter To Millennials: "If You Do Not Have 100% In Equities, You Are Crazy"
3
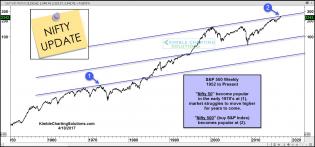
spy-nifty-50-chart-april-18.jpg (1567×736)
It was 50 stocks back then, just add a “0” today and make it the nifty 500? S&P 500 Long-Term “Weekly” Chart
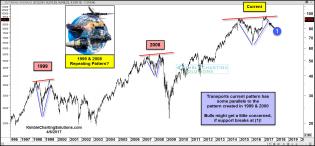
transports-could-be-repeating-1999-and-2007-pattern-april-6.jpg...
The transports are a key cog in our economy, so they also tend to be a key indicator for stocks historically.
2
20170402_bonds.jpg (768×452)
Stock-To-Bond Ratio Back At 2007 Peak
20170328_stocks.jpg (968×504)
The Last Time Americans Felt This Good About Stocks, The Dot Com Bubble Burst 2 Months Later
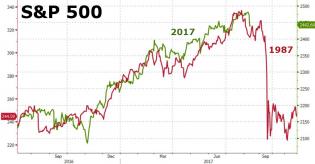
5
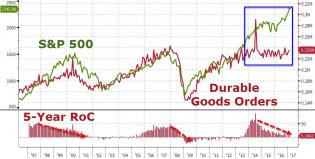
20170324_durgoods2.jpg (961×488)
Durable Goods Orders have gone nowhere for five years...
2
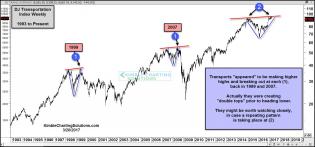
transports-creating-repeating-1999-and-2007-patterns-march-20.jp...
Transports; Could be repeating 1999 & 2007 pattern
C7CzYOuU4AE8Suz.jpg:large (1296×675)
4
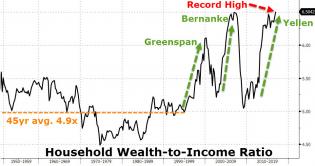
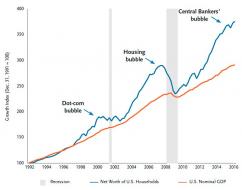
20170310_wealth.jpg (961×509)
Household Wealth Has Never Been Higher Relative To Income
4
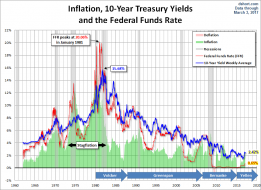
Treasury Yields: A Long-Term Perspective - dshort - Advisor Pers...
Last year was a remarkable one for yields. The 10-year note hit its historic closing low of 1.37% in July and then...
djia
Amazing long-term view of stock uptrend and channel
1
pic3268b577a81977084b90f2751b9a7b6b.png (894×513)
Market recoveries and declines measured in time
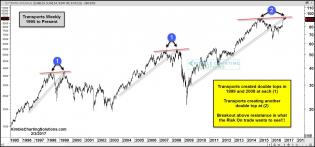
transports-could-be-repeating-1999-and-2007-pattern-feb-3.jpg (1...
Third major instance of a very bearish setup in Dow Transports
20170131_macro.jpg (946×486)
What is perhaps more immediately worrying is the seasonal tendency for a post-fiscal-year surge in Economic data f...
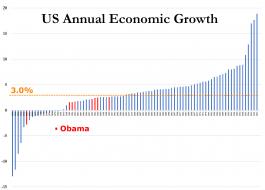
20170127_GDP_Obama.jpg (1719×1231)
And worse still, Barack Obama is the only president in US history to never have a year of economic growth over 3.0%...
2
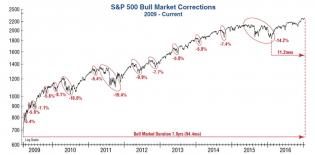
correction 1.jpg (1314×648)
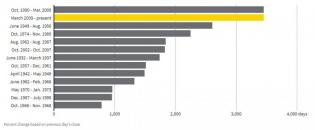
Until recently. As the next chart shows, we are now 11.2 months removed from the bottom of the last correction. Wh...
3
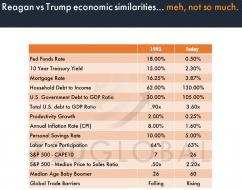
20170114_RV5.jpg (994×780)
Reagan and Trump
3
20170114_RV10.jpg (1126×807)
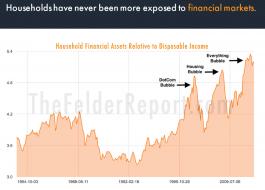
Bubble three
2
stock-bond-ratios-at-2007-extremes-jan-9.jpg (1296×680)
TLT/SPY is awfully similar (umm, identical) to 2007
1
junk-bond-divergence-to-stocks-2-years-again-dec-15.jpg (1568×705)
Junk bond divergence
3
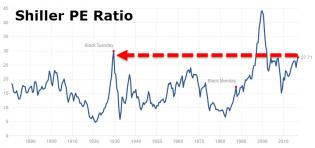
20161208_CAPE.jpg (857×404)
PE levels back to 1929
5
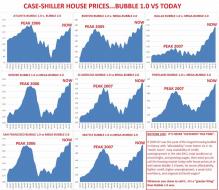
hanson bubble.jpg (947×818)
Houses NEVER more expensive
2
wmc161003c.png (791×690)
Presently, the median stock in the S&P 500 is more overvalued than at any point in U.S. history, easily exceeding...
1
Ct3dKCVWIAAGHGe.jpg:large (700×549)
Bubbles bubbles
3
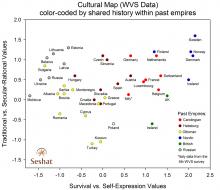
CskW68BXYAA0Tn3.jpg:large (2048×1767)
Empires past
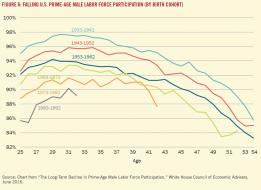
20160915 - Harvard 4.JPG (1212×881)
Male labor force participation
5

20160813_VIX5.jpg (1169×620)
VIX is unprecedentedly low for an election year
1
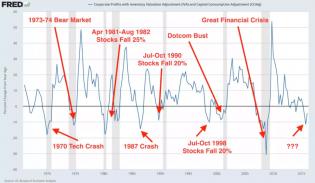
20160730_bear1.jpg (994×580)
Corporate profit plunge
20160722_VIX1.jpg (956×505)
Equities are actually considered safer than bonds now. Freaky.
2
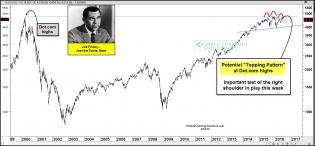
joefriday-ndx-at-right-shoulder-june-10.jpg (1574×731)
Topping pattern on the NASDAQ
1