Users: Tomb: spy weekly line break.png
spy weekly line break.png
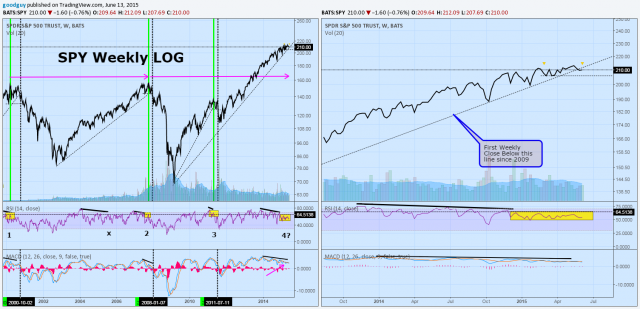
SPY Weekly Close: You can see that with Fridays down day the SPY did close below the rising trend line. Of course just because a trend line is broken it does not mean necessarily the trend will reverse. It could continue to go up at a different rate or go side ways. On the longer tern chart on the left I see the last 4 times there was a fairly long up trend line break (including this current break) At point 1 and 2, when the drop was the greatest, the RSI was <65 when the line break occurred. At point 3 the RSI was >than 65. It wasn't until a little later when there was a turn down with the RSI <65 that there was a rapid drop. We currently have a long bearish divergence with the RSI <60. The next element of a trend change is that the previous low (horizontal dashed line @ 205.74)) needs to be taken out. Also with the horizontal arrows: timing seems to be ripe for a drop. Have a great weekend.
Comments
No comments yet.

