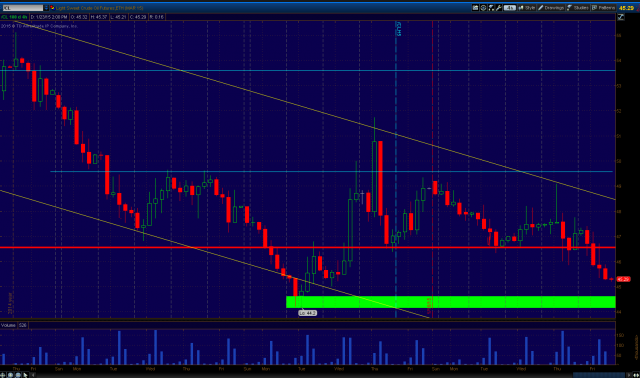
So the above is a 4 hour chart where i have shrunk the time frame down substantially. The only edit I have made to my daily chart is just adding the green bar. So the yellow trendline at the top is simply the top side of the channel. Coupled with the support line in the 46.5 area, we had a really nice triangle formation that broke nicely to the downside.
We still have the low at 44.20 to take out which may be rather resilient since we had 2 days in a row where we saw a strong bounce off .21 and .20 (1/12 & 1/13). I am more focused on closing at the bottom end of the candle rather than the wick personally, but showed a nice area where we may encounter some good short term support. 1/25/15


We still have the low at 44.20 to take out which may be rather resilient since we had 2 days in a row where we saw a strong bounce off .21 and .20 (1/12 & 1/13). I am more focused on closing at the bottom end of the candle rather than the wick personally, but showed a nice area where we may encounter some good short term support. 1/25/15