so, sorry for not posting any oil charts over the past few weeks, but here I am back again. So, as you all who have paid attention to them, I have been relatively fond of these channel moves in oil of late and all have had very similar set ups. What I have been really fond of is the triple touch channel formations that Oil has been making.
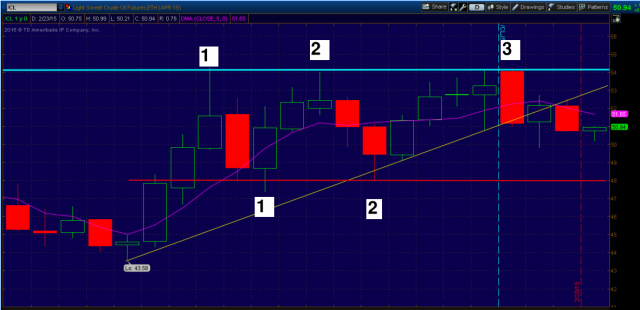
Sorry that I compressed the chart so much, but figured I would make it really simple. Obviously we are channeling again, rather than with a downward trend, we are rather flat with 2 key points. 54 and 48.
What I have come to notice over my time trading oil, there are 2 key open and close points. The pit open and the days close. We have not had a pit open above/below the 2 key s/r numbers, nor have we had a daily close above or below these points which is showing to me some major indecision in the market. It's a battle between which fundamentals are actually true.
I spoke to a few people about my personal opinion on oil at slope fest this weekend. Basically, in a nut shell, I believe the whole rig count being down deal is a farce that the oil companies are leading people on in order to raise/flatten out the price.
What people are not seeing or paying attention to is that in Q4 of 2014, oil companies increased their exploratory drilling spending by 3%. So, with companies throwing up their hands freaking out about having to shut down rigs and exploratory drilling, what they aren't telling you is that they are shutting down the rigs in high price drilling locations, while increasing the explorations in low cost areas.
I am fundamentally bearish on oil, however I believe we are at a stabilization point for the time being. I have more reasoning, but I will save that for another day. 2/22/15