Browse Symbol Stacks: /CL
slopechart_/CL.jpg
/CL Guidelines

1
slopechart_/CL.jpg
/CL Guidelines
slopechart_/CL.jpg
Blue lines determine a CL bullish bet..
1
slopechart_/CL.jpg
Solid blue lines determine CL's bullishness.
slopechart_/CL.jpg
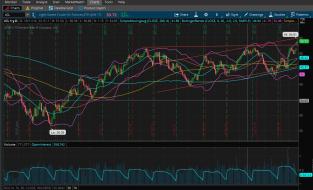
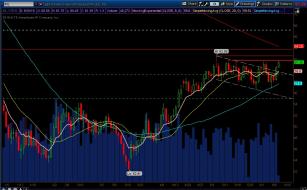
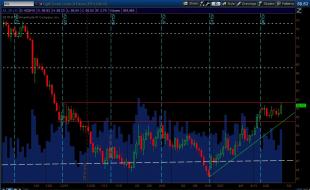
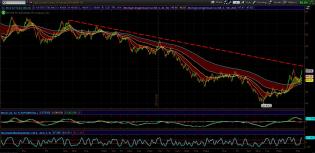
/CL riding the bottom of a triangle since leaving its double top over two years ago.
1
slopechart_/CL.jpg
Oil still looking strong

slopechart_/CL.jpg
/CL - 1990 Purple Reigns
3
slopechart_/CL.jpg
WTI - Purple reigns.
3
slopechart_/CL.jpg
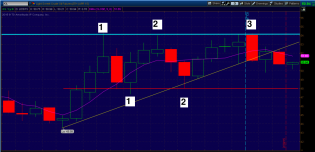
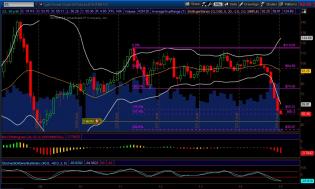
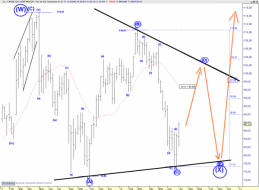
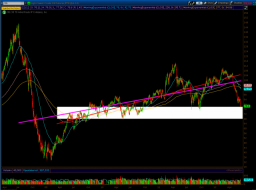
/CL - Which way next?
1
slopechart_/CL.jpg
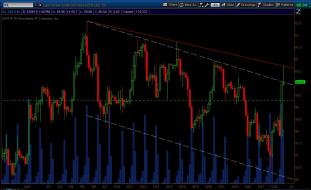
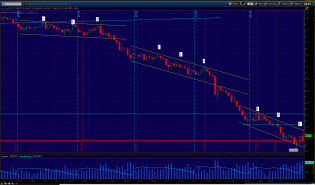
Sharp rising wedge on /CL.
Purple reigns.
If wedge breaks, first target is around 66.60.
3
slopechart_/CL.jpg
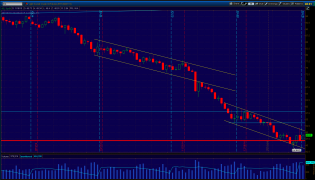
Rising bearish wedge on /CL.
slopechart_/CL.jpg
Stuck in an oil slick?

slopechart_/CL.jpg
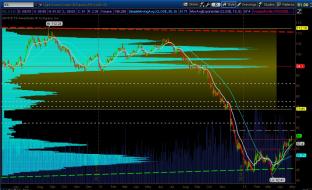
Big drop. Big save.
Turning point on /CL quarterly chart.
slopechart_/CL.jpg
Getting interesting
slopechart_/CL.jpg
From contraction comes expansion
slopechart_/CL.jpg
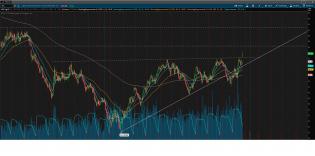
CL has been in a tight channel for near eight weeks. IV percentile is 1%. If you are familiar with the TTM Squeez...

4
slopechart_/CL.jpg
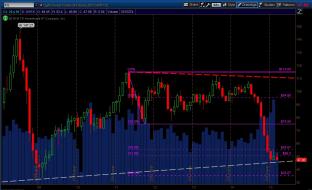
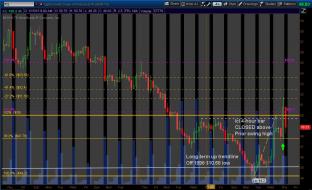
Crude Oil - WTI Crossing the Gap
The gap was officially closed on June 23 but the last two days (July 21 & 22)...
1
slopechart_/CL.jpg
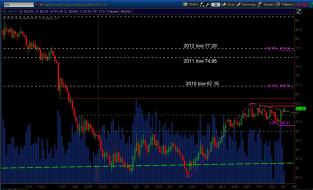
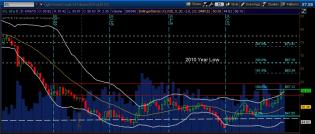
Hmm... /cl monthly chart with a trendline connecting the 2009 low to the 2016 low

slopechart_USO.jpg
Thanks @LZ agreed!
@Pipesticks - I still have no Idea how you trade this ST beast.
/GC is easy in comparison...

4
slopechart_OIH.jpg
@PipeSticks - where now brown cow?
https://www.investing.com/commodities/crude-oil
BREAKING @BBG
@Claws - PO...
9
MS slide 1.jpg (779×453)
"Flat Earth Fan"
Enough said!
$CLB $OIH /CL
Hong Kong - King Kong - Oh My! Memories of Tiananmen Square:
http...

4
slopechart_OIH.jpg
Time for a good old fashion boycott!
https://www.msnbc.com/stephanie-ruhle/watch/soulcycle-equinox-face-boycott-ca...
slopechart_DKS.jpg
NRA NRA NRA - Senator Mitch, how about a conversation about your beloved Market Snipers?
I would post another /...
2
slopechart_USO.jpg
@PipeSticks Do you have one of your long term /CL charts for us?
Thanks
5
slopechart_GDXJ.jpg
Black Gold looks interesting. That yellow barbaric relic, not so much!
/GC breaking back down. Again there appear...
1
2018-11-13_11-33-19.png (890×461)
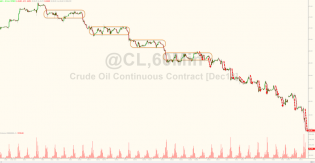
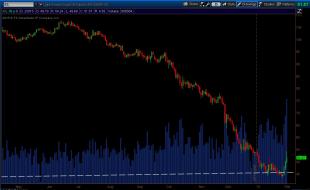
Crude oil has fallen a record 12 days in a row
2
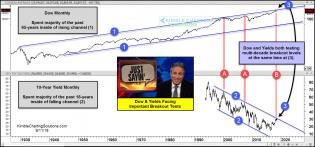
dow-and-yields-testing-multi-decade-breakout-tests-sept-11-1.jpg...
Thinking about everyone under Florance thumb. Be Safe!
https://www.youtube.com/watch?v=deG4NxkouGM
s3.amazonaws.com/cdn2.soci..._nXu6Zk_l.png
Likely steepening. Of yield curve with drop in crude soon


s3.amazonaws.com/cdn2.soci..._047bB3_l.png
Bargain in gold and oil looking vulnerable

0054B4FC-1382-4830-B7D2-74D068E9183D.jpeg
If your play in this space (@PipeSticks) /cl daily and monthly may be something to look at.
https://www.investing...
14

oil.jpg
What do you think @Pipesticks? Does that look like an inverse H&S to you?

4
CL.jpg

oil.jpg
oil chart

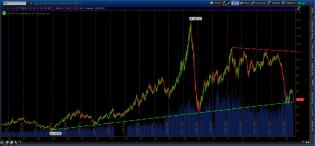
Crude_UptrendOff1998_July222015.jpg
Uptrend of /cl off 1998 low
2
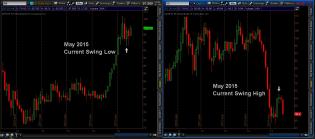
Dollar_Crude_Monthly_July222015.jpg
Swings in for /dx and /cl?
1
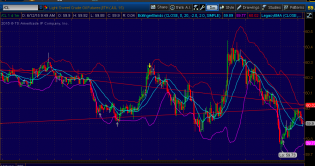
Screen Shot 2015-06-12 at 9.49.30 AM.png
Expanding ending diagonal

1
CL_Daily_June102015.jpg
Nothing like a good API -6.7mil DRAW to scare the children overnight.
Once again we've broken outside of the do...
1
CL_Daily_June022015.jpg
With the bull flag breakout in /cl underway, let's look at potential targets higher.
/cl could not even correct...
1
CL_ChannelBreak_May292015.jpg
Where did /cl stop its up move once it broke above the down channel you ask?
The red line knows. It was probab...
2
CL_Daily_VolumeProfile_May052015.jpg
WTI Crude on daily 2-year chart.
Price cracked above $61 this morning, and is into a large low volume trading a...
1
CL_Daily_April292015.jpg
Small violation of the upper zone on /cl continuous, from bear wedge mid-late December 2014.
Luckily, as Tim no...
CrudeFuts_April162015.jpg
Sadly it appears the bear party is likely over in /cl with back-toback daily closes above the previous high of the...
Gasoline_VS_Oil_Futs_Monthly_March242015.jpg
Updating the divergence, or delay, in /cl futures vs. /rb (Gasoline) futures from their monthly chart bear wedge b...
1
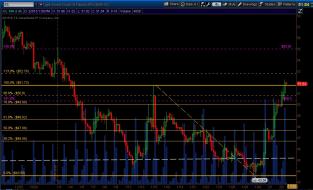
CrudeFuts_Monthly_March122015.jpg
Update on where /cl stands.
Price violated on a pit close the 61.8% level of the range since the low of 2015 ba...
2
2.22 Oil.png

2
15d 5$ tick range bars CL.PNG
15d 500Tick Range bars -Pretty Clean Fib's

1
CL_4Hour_Feb052015.jpg
4...
1
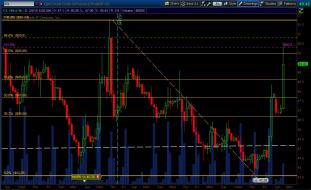
CL_Daily_Feb032015.jpg
A funny thing happened to the crude bulls on their way off "the bottom" around the long term uptrend line from 199...
2
CL_4Hour_Feb032015.jpg
Crude bears now have a candlestick reason on a major timeframe to be concerned.
As of 1:05pm est Feb 3rd, we ha...
3
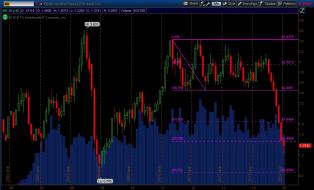
CL_4Hour_Feb022015.jpg
Crude bears DO NOT FRET ... just yet.
Coming into Monday morning trading (Feb. 2nd) we have us a familiar set-u...
7
Gasoline_Futs_Monthly_Jan302015.jpg
Gasoline futures may indicate the long drop in the crude complex is nearing an end.
/rb monthly bear wedge brea...
1
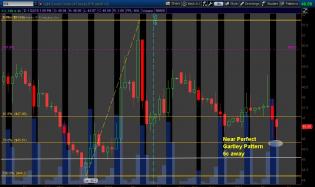
CL_4Hour_Jan222015.jpg
WTI Crude Light futures, an ugly Gartley pattern nearly fills on 4-hour.
Potential bounce on the near-fill
1
CL 1 2 3 Channels.png
3
Daily Chart.png
2
CL_4Hour_Jan152015.jpg
Bull case #2
4-hour chart /cl continuous
#1 - We have a break above, and close above prior swing high on thi...
CL0315_1600tick_Support_Jan152015.jpg
Bull case for oil shorter-term:
chart #1 1600 tick support after drop off ONH, March 2015 contract
WTIcrude_32Range_Jan152015.jpg
Bear case for WTI oil (/cl continuous) still intact longer term
Oil_OneHour_FlagBreak_Jan082015.jpg
Behold the power of the crude bears!
Hourly bar just snapped support and bull flag (2pm est)
4
Oil_1600tick_Downtrendline_Jan062015.jpg
Update to Monday afternoon (est) chart on /cl 1600 tick.
Notice where price went after nearing downtrend line
Oil_1600tick_Downtrendline_Jan052015.jpg
/cl intraday nearing downtrend line off Friday's (Jan 2, 2015) Globex high spike
Oil_BearWedgeBreak_1618Achieved_Jan052015.jpg
Target #1 on /cl monthly sell-off achieved.
Monthly bear wedge break hit the 1.618 fib projection of the wedge...
1
Oil_BearWedgeBreak_MonthlyProjection_Jan032015.jpg
My PRIMARY view on /cl direction.
Yes, we'll nearly revisit the lows from early 2009, if the technical analysis...
Oil_BullBatSetup_Jan032015.jpg
My secondary view of a POTENTIAL bottom target for /cl.
Based on fibonacci price patterns, the monthly /cl (con...
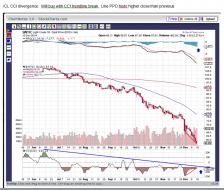
CL.jpg
/CL Will buy with CCI trendline break

11
content.screencast.com/use...775/CL4hr.gif
/CL 4 hour Chart

content.screencast.com/use.../CLHourly.gif
/CL Hourly Chart
content.screencast.com/use...6/CL82913.gif
/CL 5 min chart
Crude backtesting its breakout. Good spot to go long crude with a stop under the breakout level.

2012-10-09_0738.png (961×1072)

OIL: Update long-term EWP | SharePlanner


Seasonal Charts: Crude Oil | Signal Financial Group
Crude Oil Seasonal Studies
Screen shot 2012-06-22 at 7.48.19 AM
1
http://content.screencast.com/users/hokiejch/folders/Jing/media/113...
/CL heading down in a hurry.
