Log In
|
Create Account
Chart
Chart Lab
Drawn Objects ➟
Earnings Reactions
Guide to Patterns ➟
Modes ➟
Power Features ➟
Rotation Graphs
SlopeCharts
Video Guide to SlopeCharts
Yield Curve
Equities
Biggest Stocks
Correlations
Earnings ➟
Historical Earnings
Market Cap Charts
Power Screener
Real-Time SlopeAlerts
Super Summary
Today’s Movers
Woulda Shoulda
Markets
Commodities
CryptoStream LIVE
Economic Database
End-of-Day Report
Global Economic Charts
Macroeconomics
Market Meter
MetaSymbols
Quad Matrix
SlopeRules
Options
Analytics ➟
Backtest Strategies
Calendar
Charts for OI & Volume
Extreme Options
Options Charts
Payoff Analyzer
Strategy Explorer
Trading Strategies
Volatility Matrix
Read
Best Posts of All Time
Books by Tim Knight
Comments Search
Guide to Comments
Latest Posts
Mobile Apps
Profile of Your Host
Recommended Books
Trading Rules
Videos for You
Social
Activity Feed
Browse Chart Database
Guide to SocialTrade
Hall of Fame
Members Directory
Publishing/Subscribing
Recent Activity
Search SlopeRules
Shared Labels & Lists
SlopeTalk LIVE
Help
Best Pages For You
Custom Tiles Guide
Guide to the Site
Membership Levels
Pattern Video Library
Power Screener Guide
SlopeCharts Reference
SlopeRules System Builder
Using SlopeTalk
Video Guide to Slope
Log In
Create Free Account
Memberships
View: yield curve
yield curve
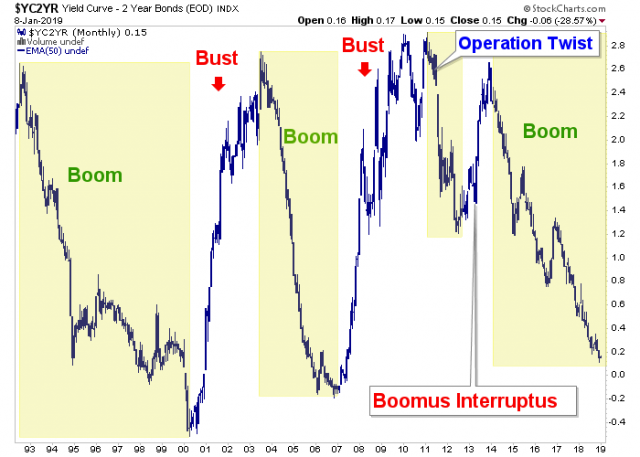
Boom/bust indicator (yield curve) still flattens (w/ boom), but risk is high at this extended point.
Image added from
nftrh.com/2019/01/09/amigo...rve-flattens/
Comments
rapidr
Ken Fisher says that the yield curve that matters is 10 year minus the 90 day Tbill
1/9/19
...
Actions
Tweet
Facebook
Stacks
Bonds
Indicators
SHY
TLT
Posted
By:
NFTRH
On:
1/9/19 8:14AM
Statistics
Viewed by 29 SocialTraders
No ratings yet