Browse Symbol Stacks: INDU
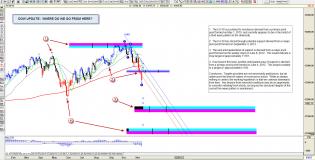
The Selloff Structure Explained – Fibonacci On Deck – Technical...

Has the Equities Waterfall Event Started Or A Buying Opportunity...
3
2020 – A Close Look At What To Expect – Technical Traders Ltd.
s3.amazonaws.com/cdn2.soci..._XmMcus_l.png
1
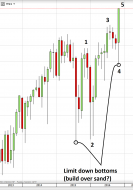
4 nov27.PNG
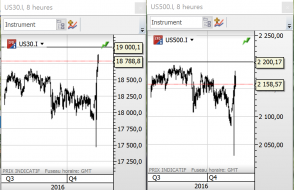
Dow industrials

1
3 nov11.PNG
S&P500 and dow jones (cash markets)
I believe there's almost zero probability that we reverse course before at le...

2 sept10.PNG
Priceless
Says a lot!
5 sept7.PNG
Scary... what after?
VIX 6.66?
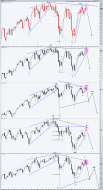
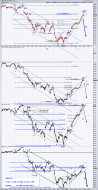
Weekly canles suggest more downside ahead.png
Notice the weekly candle formation for some of the major indices. This is also my current view of what I see as a...

1
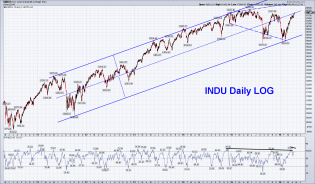
Indu daily log.png
INDU daily log: I know trying to guess tops is a fools game but sometimes I like to play games. Would not be a ba...
5
Looks bearish to me daily.png
This one is for Tim. After looking at Tim's charts for a year or so I thought I would try it out. No indicators. D...
3
WeeklyLOG INDU with fan.png
INDU weekly log: Top in for the dow industrials? I think likely.
In February I posted this log weekly with the...
3
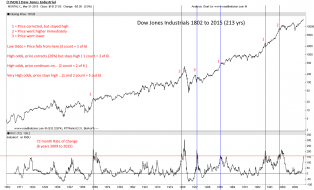
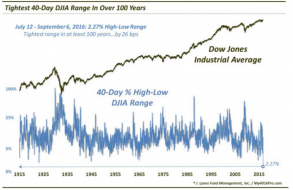
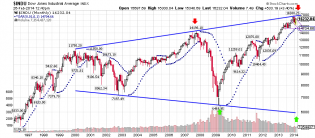
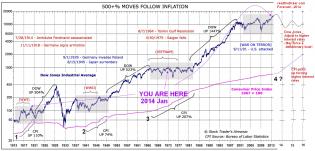
Dow 200 years

Stocks
1
indu.png
INDU Log chart daily from 2009. Will support become resistance? Approx 62% retracement. Will see tomorrow. Have...
Snapshot 6.24 daily candlessc.png
Daily charts. A lot of reversal and shooting star type candles here today. Should be good to bearish types for...
!INDU
DOW.png
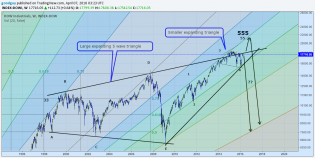
Dow Jones Monthly: Still in the good ole expanding triangle, megaphone or reverse symmetrical triangle "all the sa...

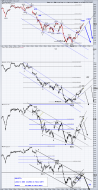
spy and stock indices update 15 min 2.11sc.png
Stock indices short term update from last week. Every one who saw the weekly hammer in some of the indices last we...
3
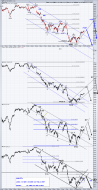
spy 15 min update2.7sc.png
Update from yesterday. All of these ETFs have now reached an important Fib correction. Will be interesting to se...
SPY 15 min after close.png
Follow up after the close of chart from early this morning. 3 of 4 charts broke downtrend lines. If longer term tr...
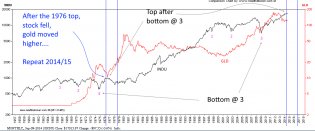
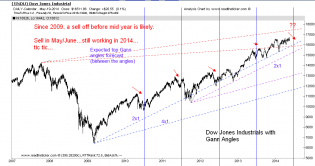
Gann
Dow Update.jpg
