Browse Symbol Stacks: IYR
slopechart_IYR.jpg
IYR gap

slopechart_IYR.jpg
Nice rejection on $IYR
slopechart_IYR.jpg
IYR with good looking 3-week downtrend.
slopechart_IYR.jpg
IYR hitting trendline
3
slopechart_IYR.jpg
The whimsical orange curve I drew a few months ago staying semi-relevant
slopechart_IYR.jpg
slopechart_IYR.jpg
ggg.png

slopechart_IYR.jpg
Massive wedge breakdown on IYR.

slopechart_IYR.jpg
Getting there...?

slopechart_IYR.jpg
IYR - To see if the channel top holds.
2
housing starts permits aug 22.jpg (1238×631)
Housing Starts Crater In July As Bottom Falls Out Of The Market

home buyer vs home builders.jpg (1236×631)
slopechart_IYR.jpg
We may have a diamond developing on the IYR
1
slopechart_layered.jpg
Layered chart of IYR Covid and 2022 analog
2
slopechart_IYR.jpg
IYR weekly, March 2020 to yesterday.
slopechart_IYR.jpg
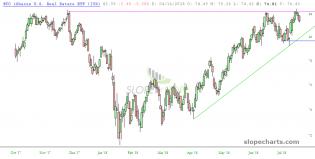
Another one to watch is IYR. Must conquer the orange uptrend from 2007 to stay alive.
slopechart_IYR.jpg
Stalling

slopechart_IYR.jpg
Pretty bearish fractal.

1

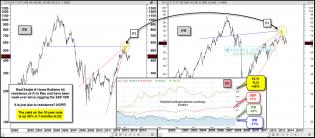
home-construction-index-create-important-top-may-23.jpg (1568×734)
2
6pa...
1
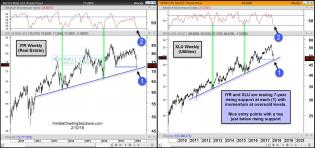
xlu-iyr-testing-7-year-rising-support-feb-10.jpg (1568×737)
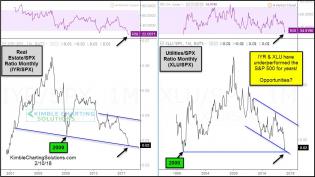
xlu-iyr-spx-ratios-deeply-oversold-feb-10.jpg (1188×671)
3
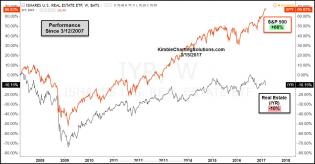
iyr-spy-performance-comparison-10-years-march-14.jpg (1296×677)
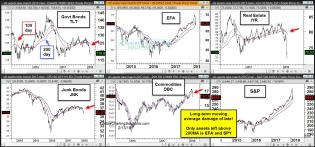
Below compares the performance of the S&P 500 and Real Estate ETF (IYR) over the past 10-years. Since the highs in...
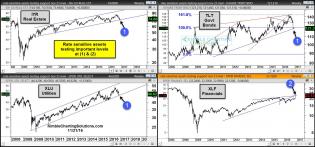
rate-sensitive-4-pack-testing-support-nov-21.jpg (1567×736)
Rate-sensitive assets
2
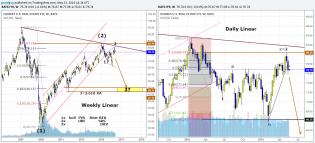
Real Estate IYR Weekly and Daily.png
I am still bearish on real estate. But after seeing the IWM correction as as EWT irregular flat (see recent postin...

2

Weekly IYR linear.png
IYR Weekly linear chart: Is real estate about to fall? I think it is very likely. The daily chart gives me a sel...
2
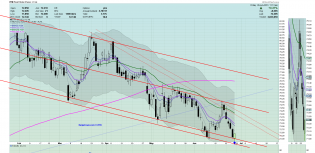
real.png
Real estate is one of the bright spots in the current climate with IYR forming a bullish declining wedge which I h...

itbiyr45percentrateincreasedec16.jpg (1565×689)
45% interest rate increase does what to Real Estate?
1

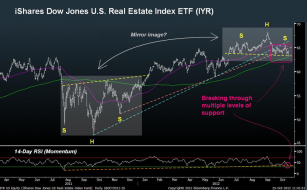
IYRanotherhandspatterncloseeyeoct28.jpg (1568×737)
Saying that Real Estate is important to the economy is an understatement, to say the least! IYR created what looks...
130830IYR2.png (828×627)
Originally pointed out $IYR as a potential short sale setup in this Aug. 23 blog post: http://blog.morpheustrading...

$IYR setting up for short sale
Why iShares Real Estate ETF ($IYR) Is Setting Up For Short Sale Entry: http://blog.morpheustrading.com/2967

homebuildersbearterrorityaug15.jpg (1572×715)
Home builders now into “BEAR” market territory, after this “KISS” took place!
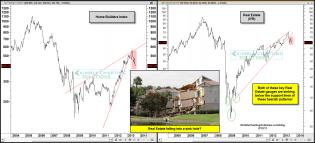
homeconstructioniyrsinkingbelowsupportaug13.jpg (1568×715)
Homebuilders and Real Estate falling into an “Economic sink hole?”
2

iyrfurtherbreakdownsjuly31.jpg (1572×738)
More Real Estate breakdowns happening! Pull broad markets with it?
IYR 2 hour.png
Potential long term trade. Good trading to you. Tom B
1
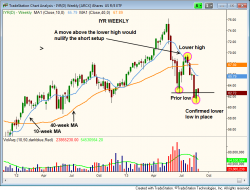
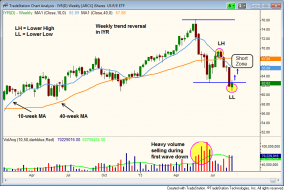
IYR weekly.png
4

iytiyrresistancejan30.gif (1558×689)
Real Estate ETF (IYR) and Transports (IYT) have been sizzling hot over the past 6 months, gaining two/three times...
joefridayhomeconstiyratresistancejan11.gif (1558×691)
DJ Home Construction Index and REITS (IYR) are nearing resistance lines that investors might want to respect.

apple chart is in a bubble


realestateslippingagainnov15.gif (1560×690)
Real Estate about to pull the economy/broad market lower……Again?
Iyrrealestate

iyrheadandshouldersfalloct23.gif (1575×732)
Head & Shoulder top in Real Estate

Real Estate Recovery Infographic
The housing market roller coaster

homeconstructioniyrfibresistancesept28.gif (1563×665)
Could this be a place where the “White Hot” home builders sector takes a break?
1

housingindexabouttocoolsept26.gif (1577×730)
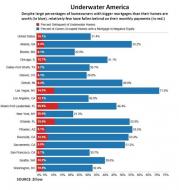
underwater-mtgs6-12.jpg (500×529)
An amazing portion of "underwater" homeowners continue to make their monthly payments.
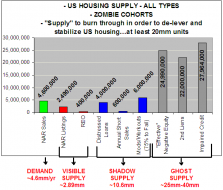
Housing-Inventory.png (611×520)
US housing supply across the board
http://blog.kimblechartingsolutions.com/wp-content/uploads/2012/06/...
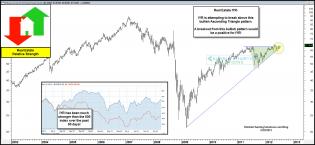
Real Estate ETF - IYR
