Browse Symbol Stacks: $TRAN
slopechart_$TRAN.jpg
More Purple Crayons
A new Mexican sushi joint opened up around here. The last one got bought out by some big na...

slopechart_$TRAN.jpg
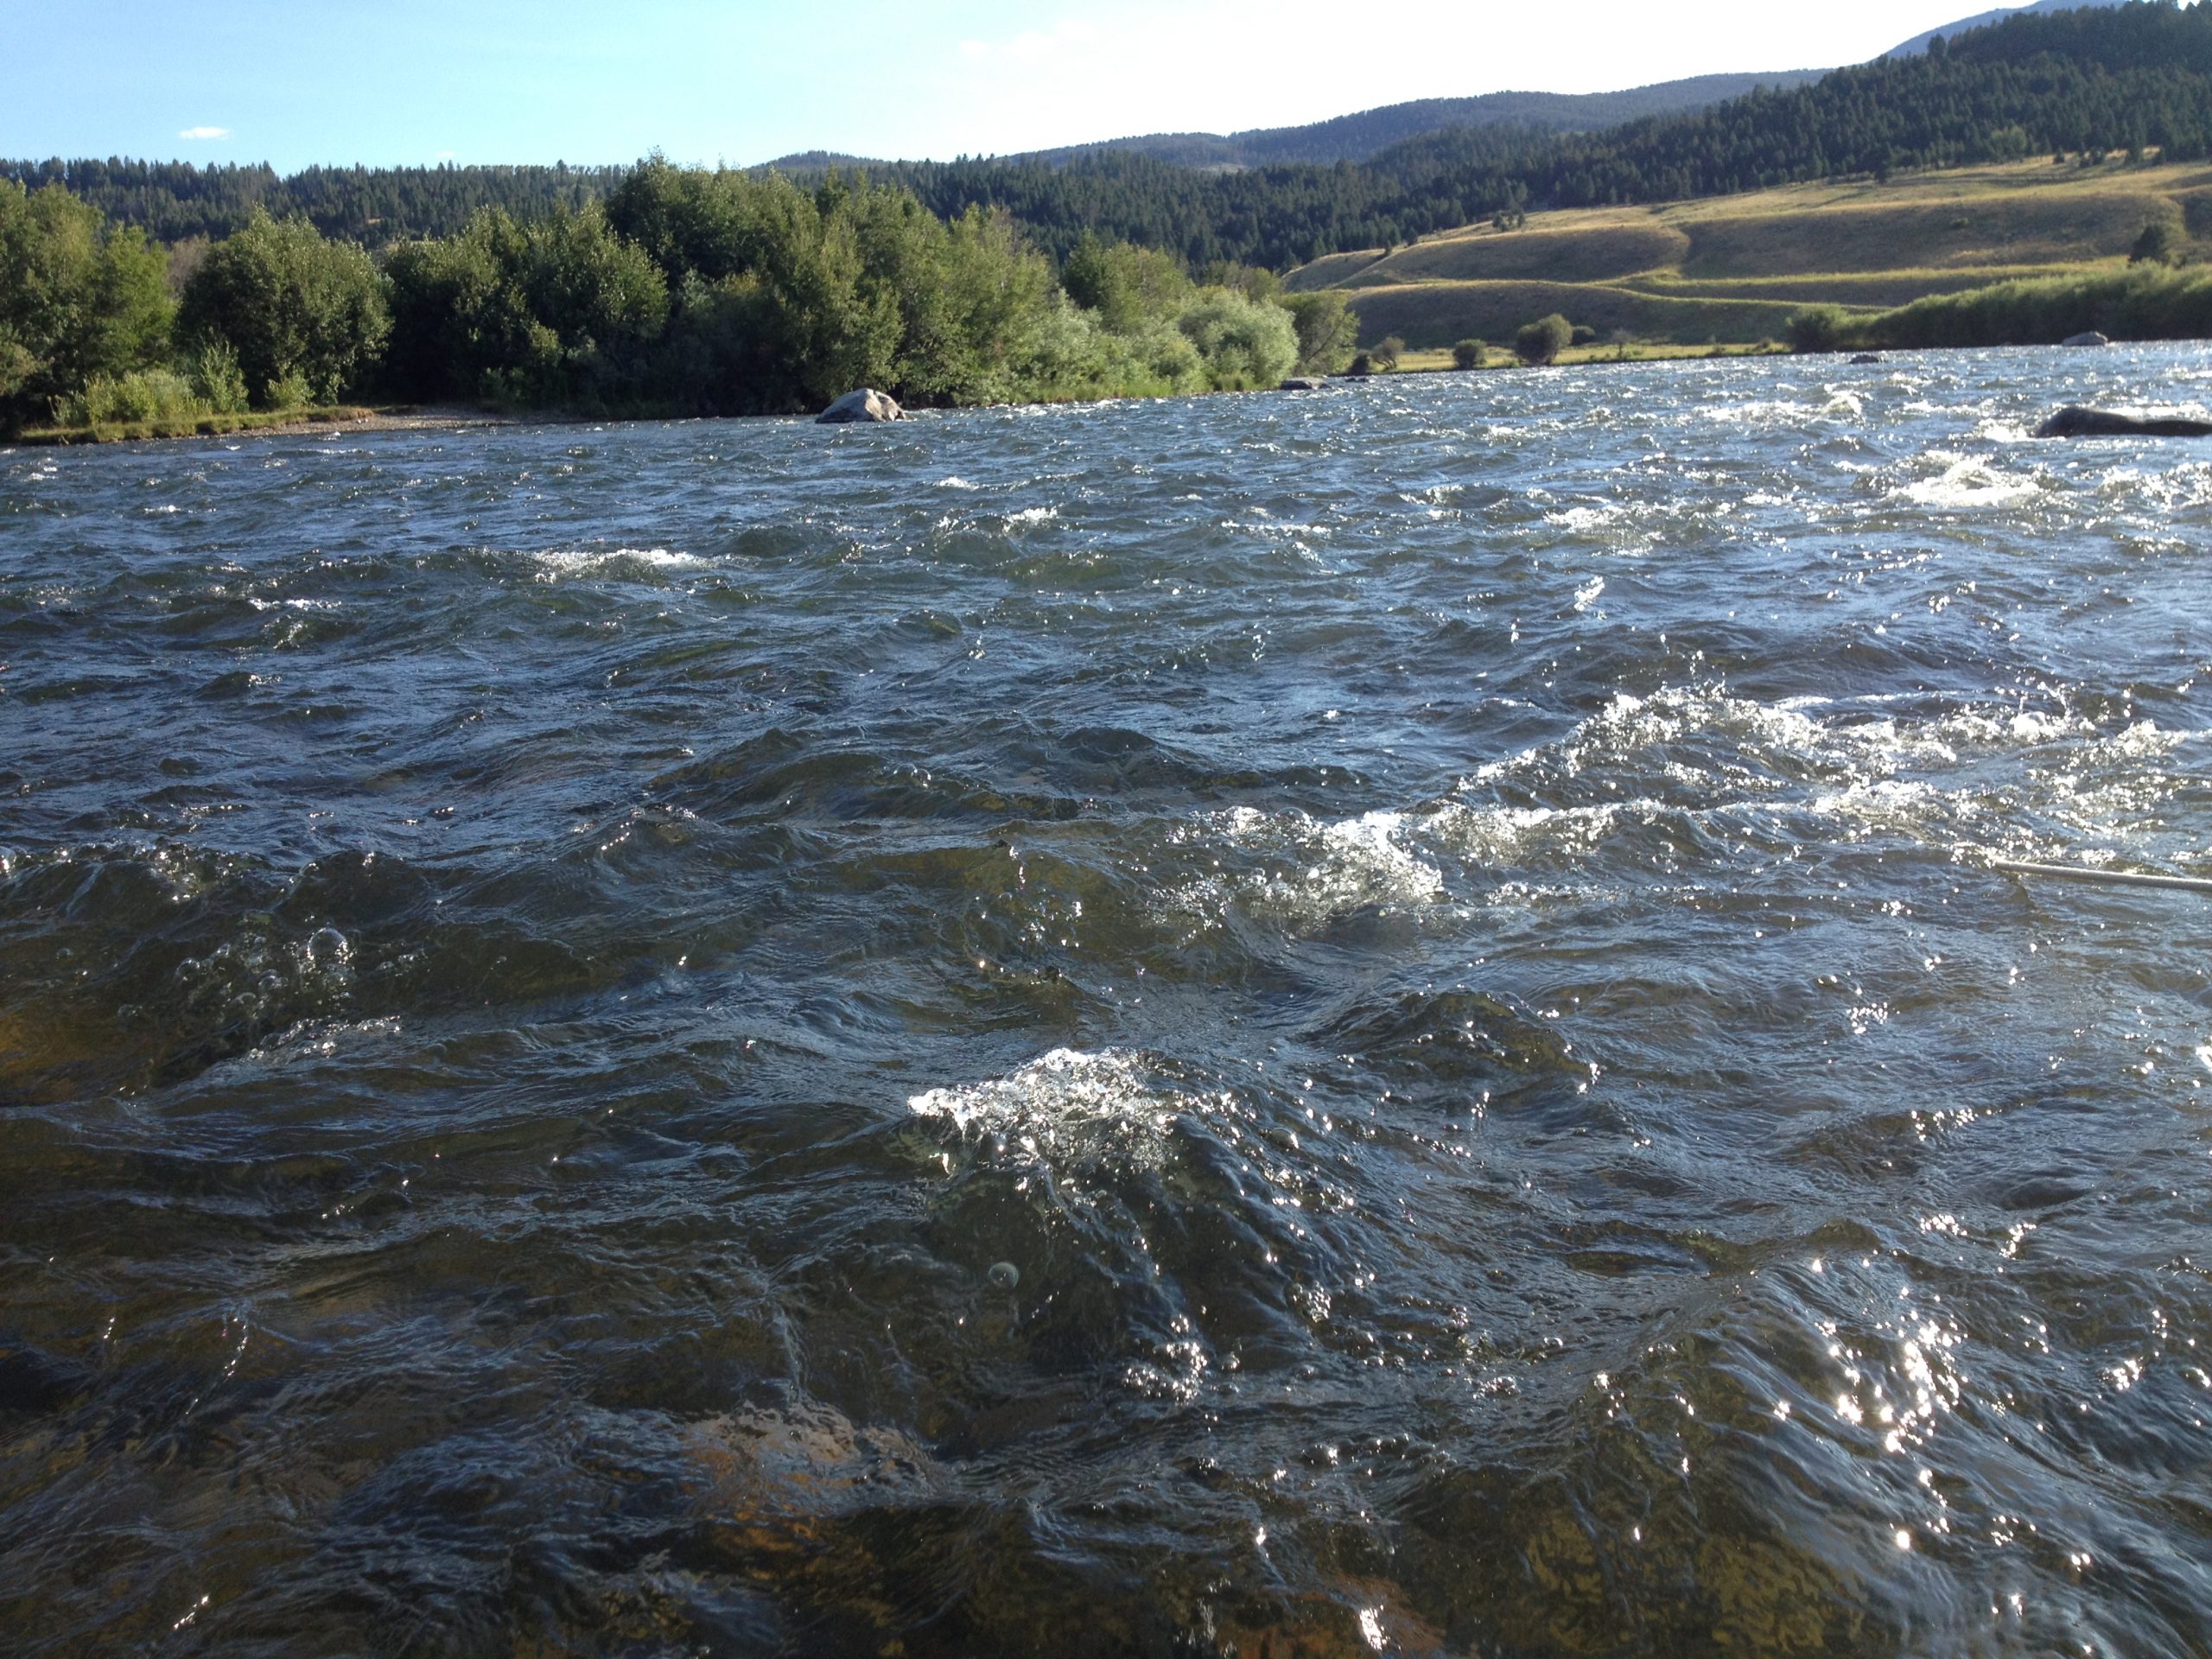
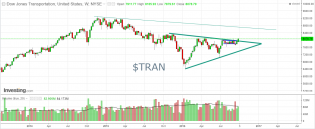
triple top
breakout, or failure from here?

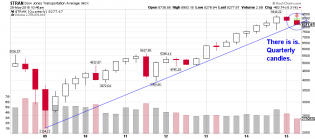
slopechart_$TRAN.jpg
423.6, because who doesn't love whimsical random number generators with their morning coffee?
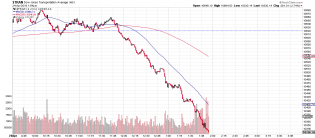
This is the DOW Tran...
slopechart_$TRAN.jpg
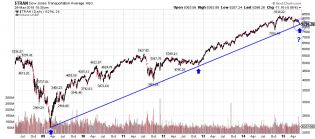
Follow up to DOW transports chart a few days back. Suddenly synced with other indices.
Hat tip to Carboni. He's...
slopechart_$TRAN.jpg
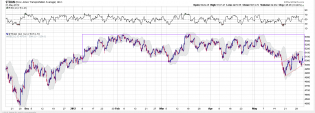
Dow Transports Covid crash to present following earlier comment by DesertEagle.
20/50/200 SMA shown.
Red tre...
2
slopechart_$TRAN.jpg
Back on top of channel.

slopechart_$TRAN.jpg
Bullish breakout.
slopechart_$TRAN.jpg
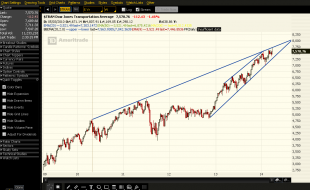
Transportation Index has spent most of the last 3 months in the upper half of a possible bear flag. The green tre...

2
slopechart_$TRAN.jpg
Falling further and further from the "Covid" gap. This is one of the prettier charts for bears. A perfect retrace...
slopechart_$TRAN.jpg
Transports were rejected just shy of the 61.8% Fib retracement today, and still remain ~5% below the Christmas Eve...
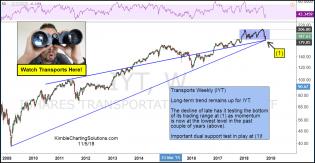
transports-testing-10-year-rising-support-oct-8.jpg (1886×911)

1
transports-testing-10-year-bull-trend-support-aug-19.jpg (1888×911)
2
slopechart_$TRAN.jpg
This is starting to look real good
slopechart_$TRAN.jpg
Failing roads, bridges, and overpasses. Look how long it took to regain the 1929 highs
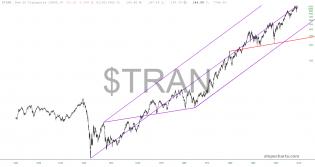
transports-could-be-creating-a-topping-pattern-at-fib-extension-lev...
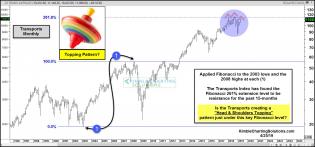
transports-hitting-heavy-resistance-suggesting-a-recession-is-comin...
2
transports-triple-support-test-in-play-nov-5.jpg (1234×641)
1
trannies.png
I need to get my sled out.

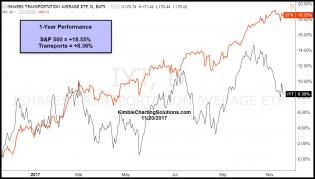
performance-transports-spy-1-year-nov-11th.jpg (1193×680)
Transports- Diverging for 1-year, testing important support
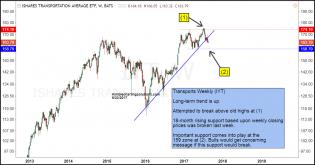
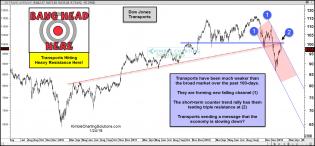
transports-break-below-18-month-support-aug-23.jpg (1296×679)
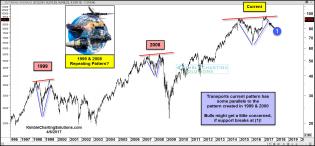
transports-could-be-repeating-1999-and-2007-pattern-april-6.jpg...
The transports are a key cog in our economy, so they also tend to be a key indicator for stocks historically.
2
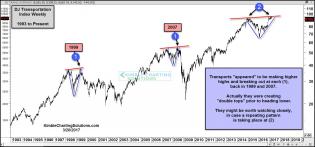
transports-creating-repeating-1999-and-2007-patterns-march-20.jp...
Transports; Could be repeating 1999 & 2007 pattern
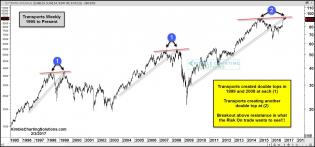
transports-could-be-repeating-1999-and-2007-pattern-feb-3.jpg (1...
Third major instance of a very bearish setup in Dow Transports
20161001_TRAN.png
bulls have a ball

2
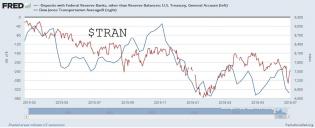
TRAN_TREASURY.jpg
As I recently said there is correlation between $SPX and inverted Treasury account (someone sell stocks to pay Tax...
Treasury.png
I have studied Treasury financing schedule (debt issuance and redemtion) which is available at treasury.gov. Q2 wa...
2
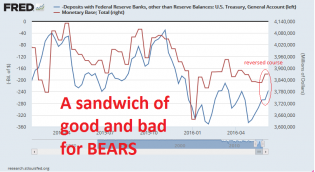
TRAN_SP500_MonetaryBase_Treasury.jpg
Recently I said that Monetary base is acting as leading indicator for Stock Market Indexes. Now I found that there...
2
MonetaryBase_TRAN.jpg
Carnage is coming back this summer.
1
Transports - Daily - 3.29.16.png
Transports - daily chart. This is not investment advice.

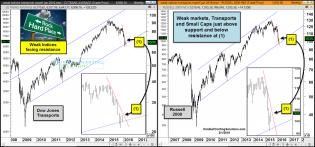
transportsrussell-rock-and-hard-place-feb-1.jpg (1570×733)
Transports, Russell, and their trendlines
1
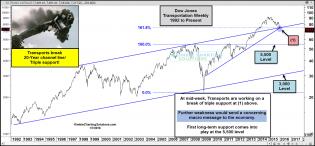
transportsbreak20yearsupportchanneljan7.jpg (1571×733)
Transports are poised to just keep collapsing
3
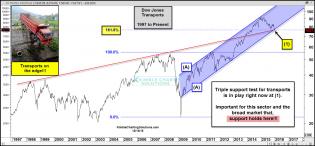
transports-triple-support-on-the-edge-dec-101.jpg (1571×733)
Transports on the cusp of another leg of their collapse
1
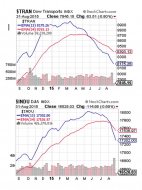
Tran and Indu Birdie Crosses - Dow theory.PNG
$TRAN and $INDU 13/34 Week EMA crosses
Pure Dow Theory signal - "Birdie Style"

1
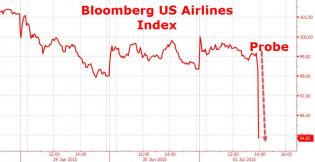
20150701_air.jpg (965×498)
Airlines Stocks Plunge After DoJ Probes Collusion On High Prices
3
tran.png
$Tran: Uptrend broken. Tim's data trumps all.

5
trans.png
$Trans: Transportation Index hasn't quite broken down yet at least according to my data.
4
2014-04-05_TRAN.png
5 year resistance on TRAN still holding strong.
2
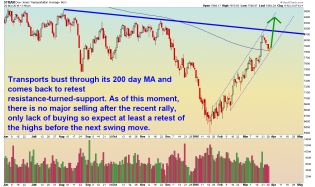
transportsdrivethruresistancesept13.gif (1576×729)
dshort Featured Charts
Dow Transports
2012-05-31_1825.png (1415×510)
Bear flag on $TRAN
