Browse Symbol Stacks: USDJPY: Blanks of the trader
Blanks of the trader
I came across trading analogy to crossing pedestrian zebra some time ago and last week had a chance to connect the dots and draw the relationships having the raw live trading situation. I believe i had two calls last week that i got out of during the week progressed. Will focus on EUR/USD long setup where i had my long limit entry at 1.3180 before market open last week. Market opened lower and came about as low as 1.3182 before moving north. As an outcome i did not get my long fill, which lots of traders will find emotionally unsettling. Having seen this type of scenarios playing out many times i sharpened my focus on this market as i still had my long limit order setting on anticipation that market will come back to test this area again. What happened next was market hit 0.382 fib retracement and stalled there. This was a warning sign as you have when waiting to cross the street when yellow mark lights on, when later i saw market moving south towards my limit order fill, yellow gradually turn to red as it was time to cancel my limit order knowing that 0.382 fib retracements usually mean trend continuation and having my long limit order active would increase the risk of being stopped out big time. Think about the actions you take while waiting to cross the street, everyone must follow he same rules in order to avoid fatality, same as everyone expects cars to stop when pedestrian sees the green lights. What I'm getting at is that having defined clear set of rules and actions and following them without compromises pays off long term. Regardless how anticipated setup is positioned against the market, trader must know what to do next, otherwise things can go wildly out of hands in no time.
Another confirmation of this was Gold (XAUUSD) setup posted last week, baerish BAT pattern got filled and gave quite some paint initially as it looked like the market will continue to go higher. Ragerdless how hopeless this position looked initially market never closed above 1619's on 4 hour chart and my stops were high enough so i was not taken out. When the highest 4 hour candle on the week closed below 1619, it was green light to readjust my initial targets and since then i had to watch fairly smooth roll to the south hitting 3 targets on a way and potentially more as i'm still running the profits on this setup, again having the rules defined paid off.
Plenty of setups for the next week as well in my watchlist. On indices side CAC40 market is ranging between 3790 and 3610. I will consider to take advantage of both sides of this fairly wide range spectrum sideways markets as next week unfolds.

South African Alsi40 index had fair amount of indecision recently. Spotted bearish Shark pattern right at the top of last highest high on 4 hour chart.

Much dwelled about earlier EUR/USD pair has 3 drives pattern that was technically completed last week. I did not take it straight on as completion was pretty much in the middle of nowhere. Since then marked bounced a bit to 0.238 fib retracement so will be looking for a buy at 1.2967's area in case market will decide to test these lows again. If will go to 1.31's first will be looking to cancel this setup.

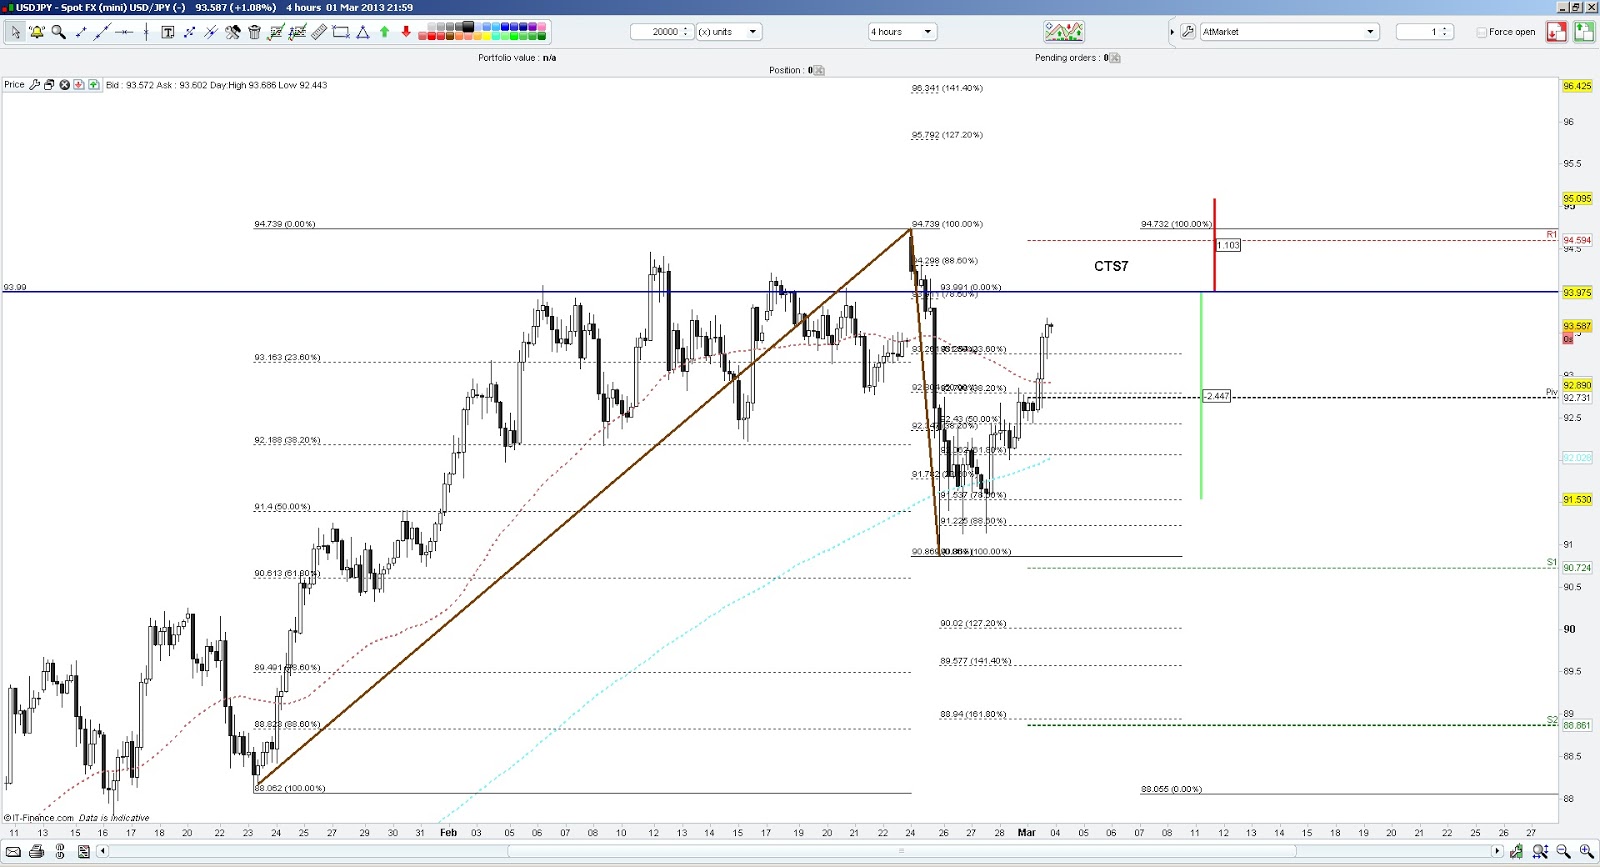
Lastly for next week is USD/JPY pair. There is a way to play this market very aggressively on the short side at 94's area where aggressive C pattern completes. What makes me very cautious about this setup is that more than 100 pips of risk has to be taken on board and this is still very much bullish market. My entry parameters are red so will be leaving this setup for other traders to take advantage of.
This will sum up this weeks stub, just before i let you go check out new recommended blog section. Very good reads there to dive in as well. Have a good one traders!
Comments
No comments yet.

