Browse Stacks: Trading: Currencies
GBP_USD Mini_20250326_04.25.jpg
I am shorting Cable through GBP/USD mini because of the Chancellor of the Exchequer's Spring Statement on Wednesda...

1
slopechart_UDN.jpg
asymmetric bet on coming dollar weakness
price targets

26af98b112d80c579ee38c8dcf947505.png (1567×764)
The euro managed putting in another "false" breakout move and is now back inside the range. Our general take is no...

slopechart_$SPX/FR:CURRCIR.jpg
S&P 500 divided by currency in circulation
stocks have held up relatively well during the onslaught of
money printing
slopechart_$TNX*$DXY/16.1.jpg
MMRI declining, markets pumped up
watch this space
if it breaks to the upside, things may change
slopechart_$TNX*$DXY/16.1.jpg
MMRI - market risk still declining
slopechart_FXF.jpg
short term TL break out
slopechart_$DXY,$VIX.jpg
Dollar vs VIX
slopechart_FXF.jpg
losing digits on the catch the falling Swiss knife trade
slopechart_FXF.jpg
Swissy holding so far
slopechart_FXF.jpg
Swissy ugly, but holding so far
slopechart_FXF.jpg
Looking to catch a falling Swiss knife?
tp16.png (953×563)
M2 growth is printing negative for the first time in ~90 years
1
2023-04-22_14-02-54.jpg (565×432)
The U.S. dollar’s share of official global reserve currencies has gone from about 73 per cent in 2001 to around...
3
Hart 1.png (1280×880)
2
slopechart_UUP.jpg
a buck for a rainbow
Emerging markets ETF (EEM) and US dollar (UUP, USD)
If you ever want to short USD, just buy EEM. Inverse EM is USD.

slopechart_$DXY.jpg
Dollar back at the 61.8% Fib
The gold price as adjusted by major currencies
Corrections to the nominal gold price will come, but gold's ratios to major global currencies imply a real bull cycle.
slopechart_$DXY.jpg
Amazing Fibs on the Dollar. Do we get a bounce from here?
us dollar index (DXY), usd
Uncle Buck eyeballs the 99 level and a 62% Fib retrace.
gold price in various global currencies
Gold priced in global currencies, fyi...
1
GBPEUR.jpg
$GBPEUR IH&S on the 1d chart. If you look at the 1h chart you'll see bull flags in quick succession. This is likel...
1
Gold in Euros holds trend – Notes From the Rabbit Hole
Gold in Euros holding major daily uptrend at the SMA 200.
BTC/USD is not buying it – Notes From the Rabbit Hole
Bitcoin touts fail to rally the sheeple troops during market sentiment rally (at least so far).
slopechart_/ES.jpg
200 Week Average /ES during 1st leg of British Pound Crisis

2 Horsemen of (macro) Apocalypse ride on… – Notes From the Rabbit Hole
Here's USD's fellow rider in market liquidity destruction, the Gold/Silver ratio.
2 Horsemen of (macro) Apocalypse ride on… – Notes From the Rabbit Hole
When USD & Gold/Silver ratio rise together it's usually... ruh roh! Liquidity crisis.
dollar strength extreme_1.jpg (1057×736)
2
slopechart_$BTC.jpg
My first go at technical analysis on a wide time horizon for Bitcoin. Fun trying to pick out different features, I...

2
slopechart_EUR/USD.jpg
Interesting long term chart of Euro/USD. We went like one pixel beyond the trendline before pulling back a bit....
1
Bitcoin: Acting like the speculation it is | Notes From the Rabb...
USD... up.
1
slopechart_/6A.jpg
Don't think there are many forex traders here....but -- Aussie dollar has been bouncing off it's lows for about a...
2
slopechart_/6A.jpg
Not the most bullish chart -- but went long Aussie dollar today based on correlation to gold. Safer entry point i...
3
ASD ASX.jpg
Australian Dollar ($XAD) divided by Australian Stocks ($AORD). Looking interesting.
USD & Gold/Silver ratio each bounce | Notes From the Rabbit Hole
If USD keeps rallying *AND* the Gold/Silver ratio also puts on an extended rally the markets are going to flush in...
1
USD & Gold/Silver ratio each bounce | Notes From the Rabbit Hole
USD bounces to test SMA 50, as anticipated.
dxy, us dollar
Uncle Buck cracking the SMA 50, more downside likely in Q1 2022, and more upside in commodities and the inflation...
slopechart_$DXY.jpg
Next leg up on the Dollar?
us dollar (dxy)
Uncle Buck (DXY) holds support, looks to rough up the inflated macro this morning.
2 Horsemen | Notes From the Rabbit Hole
Gold/Silver ratio (along w/ USD) is and has been a warning to commodity/inflation/reflation bulls. A metallic cred...
3
fredgraph.png (700×718)
Purchasing Power Of The Dollar Since Camp David, August 1971
1
eur/usd
EUR/USD looking disgusting. Daily chart breaking down from a small bear flag that failed to climb above the SMA 200.
bitcoin
Don't look now, Bitcoin kids... neckline pierced and theoretical target sub-zero.
6
bitcoin
Target finally - and gloriously - in for BitCON.
1
slopechart_$DOGE.jpg
Court Jester leaves the Royal Audience in stitches, awarded Medal of Astute Chicanery by the Queen. .22 was the pu...

2
Global-Reserve-Currencies-USD-share-2014_2020-q4.png (494×440)
US Dollar's Status As Dominant "Global Reserve Currency" Drops To 25-Year Low
1
spx hui usd
Though most bugs don't see it that way, this is as it should be in the purest form of gold mining fundamentals. #o...
1
Make Way for Uncle Buck | Notes From the Rabbit Hole
Looking for Uncle buck to 96 on A-B-C upward correction.
spx and us dollar
Inverse USD up? Stock market up. Inverse USD down? Oh yes, stock market down.
1
USD-2_1.png (1280×687)
us dollar
Bringer of the pain #2.
dxy
Finally, the bounce in Uncle Buck that would bring a temporary liquidity issue after a bubbly summer.
dxy
Uncle Buck maintains its bounce pattern despite ECB tacit euro support earlier today.
USD-4_0.png (1240×709)
USDSPX.jpg
Out of the box thinking when the USD has been weak. How $USD compares with $SPX. Is there potential support here o...
2
USDJPY BOFA chart.jpg (1220×1049)
dxy weekly chart.jpg (1215×1051)
EURUSD weekly chart.jpg (1222×1049)
try.jpg
Weekly log chart of USD/TRY showing a cup and handle formation. Turkey's central bank has thrown most of its forei...
2
USD2.png (1240×1037)
Sven is bullish the US dollar
2
dxy
USD bouncing but not bullish.
slopechart_GLD/FR:DTWEXBGS.jpg
A variation on paper gold vs. paper currency: This is gold, real or imagined held by GLD vs. the trade-weighted U...

dxy, us dollar index
Bananas for all? USD index losing S/T support.
slopechart_FR:DTWEXBGS.jpg
U.S. Trade-Weighted Dollar. Target around 131.
1
hmm.jpg
Bull flag on the monthly USDTRY currency chart. This one has moved slowly but it's just about got to where there i...
1
king-dollar-double-top-or-breakout-april-23.jpg (1885×912)
1
The Long Finger of Doom
Asian Contagion
2
slopechart_/GC.jpg
"Waiting is a skill, just like any other."
Jack Reacher
slopechart_USD/JPY.jpg
USD/JPY daily chart holding downtrend line pretty well

2
bfmF5FC.jpg (976×508)
The Dollar rallied for the 8th straight day, soaring to a new record high
us dollar & gold/silver ratio
When they ride together they bring the liquidity destruction. That's happening now. The big question is when will...
bfmF457.jpg (976×511)
Today was the worst day for a combined equity/bond portfolio... ever...
bfm7E3.jpg (1280×677)
bfm2BF4.jpg (976×506)
king-dollar-breakout-or-peak-at-top-of-this-channel-feb-20.jpg (...
bfm67EB.jpg (976×508)
1
gold/currencies
Gold in major currencies, weekly chart...
bfm136D.jpg (976×511)
king-dollar-testing-channel-and-fib-support-jan-9.jpg (1888×913)
slopechart_UUP.jpg
Small Topping Pattern On The Dollar

usd
USD finds resistance at SMAs 50 &200 and is down hard in pre. It's holiday slack season so that's a caveat. Associate...
s3.amazonaws.com/cdn2.soci..._l1oCKk_l.png
Why MMT is a really really bad idea

1
slopechart_USD/CLP.jpg
USD/CLP (that's Chilean Peso, what's left of it).
1
gold-franc-both-testing-resistance-at-the-same-time-oct-11.jpg (...
slopechart_USD/TRY.jpg
War. What is it good for? Absolutely nothing so far. Long USD/TRY. Nothing much happening on this slow burning bul...
2
bfm599D.jpg (976×510)
1
s3.amazonaws.com/cdn2.soci..._2t7yKr_l.png
The “market” responds to trade talk option but then USD/CNY does not
1
king-dollar-testing-breakout-level-aug-21.jpg (1892×911)
1
Brexit.jpg
Yet another estimate.
H.M.S. Agamemnon laying cable.jpg
The H.M.S Agamemnon laying Cable. One of two ships involved in laying the transatlantic Cable. That Cable is the r...
Cable.png
Cable since January 2016 appears to be forming a large 'W'. Likely to continue bottoming at least till 31 October 2019.
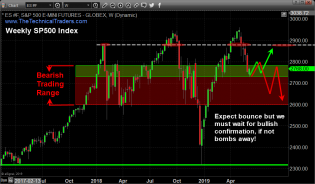
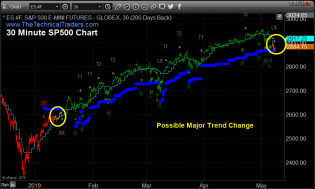
US Dollar Strength Will Drive Markets Higher – Technical Traders Ltd.

6
Fed Leaves Rates Unchanged – Gold & Stocks Rally/Dollar Fall...
US Dollar Rallies Off Support But Is This A Top Or Bottom? – T...
Index Prediction System Is Telling Us A Very Different Story –...
1
King Dollar Rides Higher Creating Pressures On Foreign Economie...
Technical Analysis Shows Aug/Sept Market Top Pattern Should For...
Second Half of 2019 – Expect The Unexpected – Technical Traders Ltd.
My Dream Trading Tools Are Almost Automated! – Technical Traders Ltd.