Browse Symbol Stacks: XHB
slopechart_ITB,XHB.jpg
home builders

slopechart_ITB,XHB.jpg
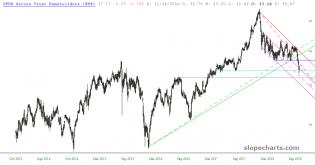
XHB in the lead
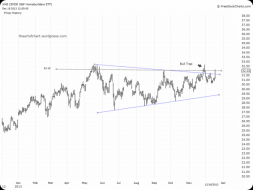
slopechart_XHB.jpg
XHB at long term trendline. No, it's not linear.

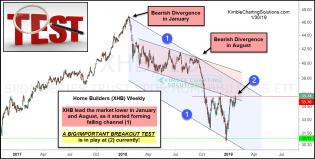
2
slopechart_XHB.jpg
XLB determinants.

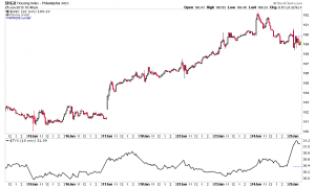
housing starts permits aug 22.jpg (1238×631)
Housing Starts Crater In July As Bottom Falls Out Of The Market

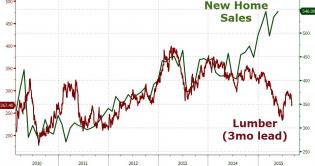
home buyer vs home builders.jpg (1236×631)
slopechart_XHB.jpg
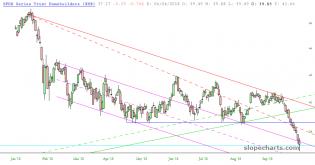
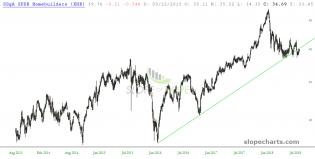
channel breakdown with bounce

slopechart_XHB.jpg
Nope, no housing bubble this time. A run on existing homes maybe, but commodity prices are making new constructio...

slopechart_XHB.jpg
In synonymy with SLM, we get XHB breaking channel. Housing bubble?
4
slopechart_XHB.jpg
2nd pass at XHB. Converging cone broken to upside. Projected ceiling at 70 taken out.
slopechart_XHB.jpg
XHB 2: It's in a nice upward channel (see parallel blue lines). Could go upside of that channel if it nukes 70 b...
slopechart_XHB.jpg
XHB looks like about the strongest thing out there right now. Support started at 41 in May 20, migrated up to 50...
home-construction-index-dec-2018-lows-become-key-march-25.jpg (1...
1
homebuilders-testing-2000-highs-dec-3.jpg (1556×827)
xhb-testing-very-important-breakout-test-feb-6.jpg (1261×644)
homebuilders-facing-important-breakout-test-jan-30.jpg (1265×642)
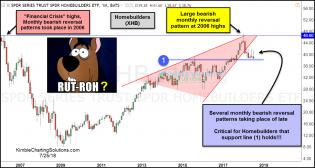
home-construction-repeating-2007-pattern-dec-10-1.jpg (1569×736)
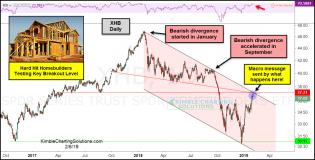
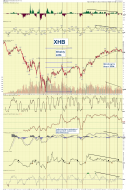
XHB
1
slopechart_XHB.jpg
A closer look. It amazes me how the top of the pink channel that was resistance is now acting as support.
slopechart_XHB.jpg
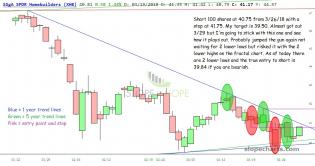
Looking for a bounce back to blue support line to get short. I tried shorting this last month from 8/9 to 9/21 exp...
slopechart_XHB.jpg
Key backtest of broken bullish trendline. I saw someone else mentioned it here just double checking my charts.
home-builders-creating-bearish-reversal-patterns-below-2006-highs-j...
slopechart_XHB.jpg
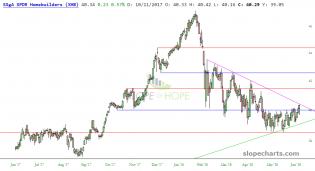
Critical test of bearish trend line (magenta).
home-construction-index-create-important-top-may-23.jpg (1568×734)
2
slopechart_XHB_33018.jpg
Evolution of a newbie trader in this choppy market. Trying to combine chart patterns, candlesticks, and fractals o...
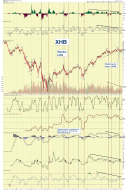
20150722_EOD6.jpg (955×504)
A bit of a divergence here!
3
XHB weekly 7.31sc.png
XHB Weekly log. Just a follow of my chart of 6/20 when XHB was 32.15. I would not be surprised to see a drop to...

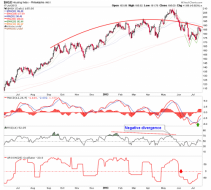
XHB homebuilders weekly 6.22.14.png
Homebuilders running out of steam? When there is a negative divergence in multiple indicators it often leads to a...
1
xhb
A Guide To American Houses Part 2

hgx
Homies no like taper talk...

hgx
Homies no like rising long-term yields...

Real Estate Recovery Infographic
The housing market roller coaster
homeconstructioniyrfibresistancesept28.gif (1563×665)
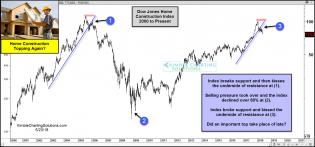
Could this be a place where the “White Hot” home builders sector takes a break?
1

housingindexabouttocoolsept26.gif (1577×730)
homeconstructionremainstrongsept11.gif (1576×729)
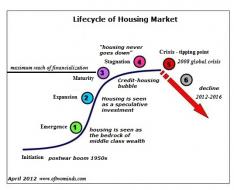
housing-curve.jpg (536×435)
1

ON-AY514_cover0_KS_20120908012730.jpg (800×800)
Barron's cover - another contrary indicator?
dshort Featured Charts
As the number of households shrink, the demand for housing drifts down
aw3.png (883×647)
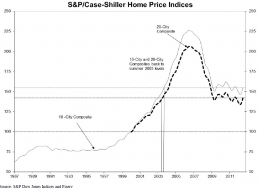
Home prices are basically back to where they were in 2003
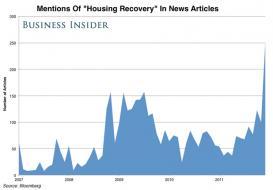
housing recovery
The media is getting a little obsessed with the so-called housing recovery.
1
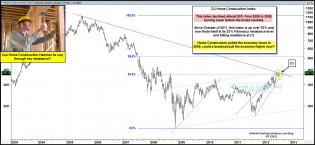
homebuildersresistanceaug13.jpg (1577×730)
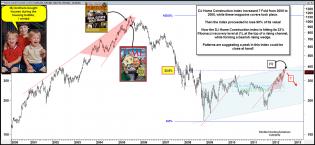
Dow Jones Home Construction Index
1
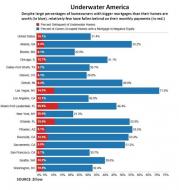
underwater-mtgs6-12.jpg (500×529)
An amazing portion of "underwater" homeowners continue to make their monthly payments.
house4.gif (750×619)
Total housing completions
dshort Featured Charts
Home construction index
1
Lumber.gif
Chart In Focus
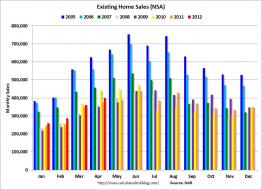
EHSNSAApr2012
existing home sales NOT seasonally adjusted. Ie pure data as opposed to manipulated data. Shows sales up YoY but...
