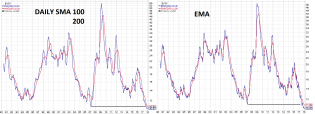
Browse Stacks: Trading: Derivatives
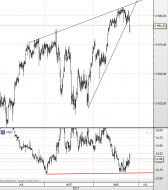
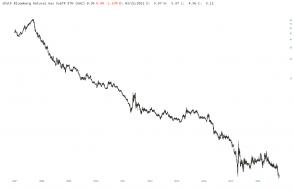
slopechart_$SPX.jpg
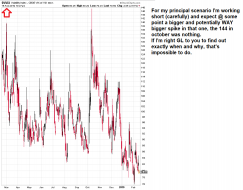
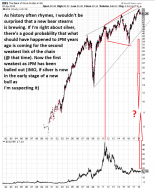
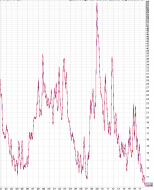
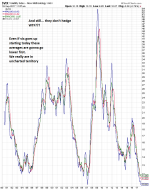
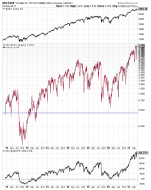
S and P
TRADE YOUR VISION they said.
My vision is blurry, blighted by some cornea problem that can't be repa...

1
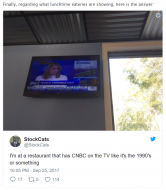
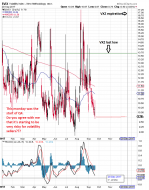
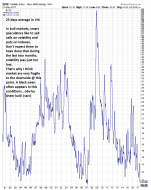
Capture d'écran 2024-01-30 180934.png
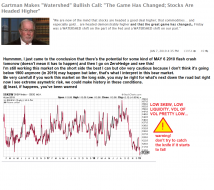
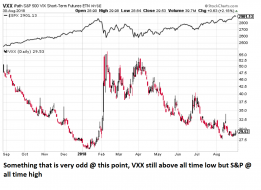
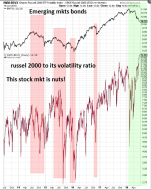
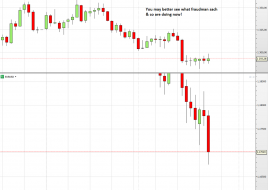
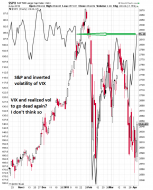
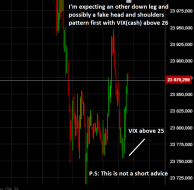
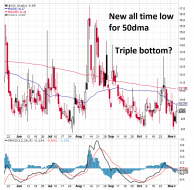
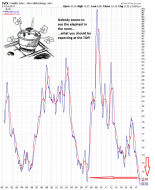
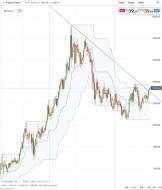
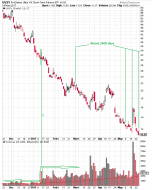
This is our market today! ALL a volatility trade.
As structured products supply so much vol it pins the index an...

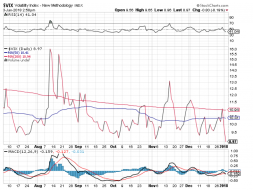
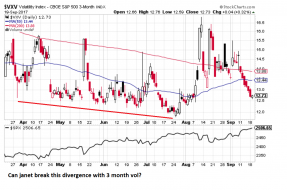
VIX.jpg
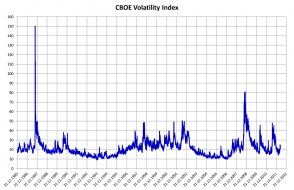
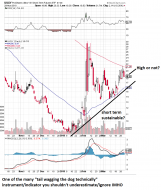
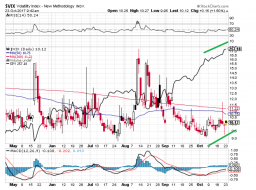
$VIX chart from FAIRLEAD STRATEGIES
https://www.marketwatch.com/story/wall-streets-fear-gauge-is-flashing-a-warnin...

recordmargindebt.jpg
Record Margin Debt
1
chart.png
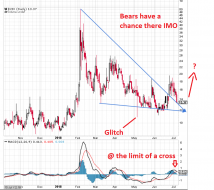
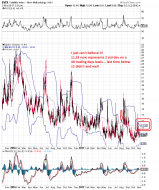
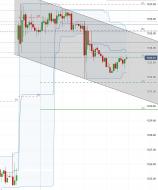
/ESM0 Fib retracement on 1hr chart.
8
Weekly.jpg
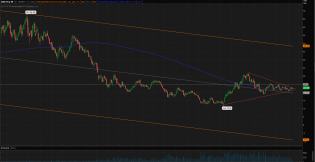
Thought I'd have another look at the weekly chart to see if there was anything new that might make sense. The Blac...
3
bfmF457.jpg (976×511)
Today was the worst day for a combined equity/bond portfolio... ever...

maund.jpg
From Clive Maund article.
3
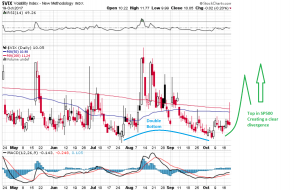
slopechart_TVIX.jpg

1
slopechart_RINF.jpg
Ooh look! There's an ETF for inflation. Trend is still down overall! ojo
NUGT.png
http://www.321gold.com/editorials/sfs/hubbartt092019.html

1 feb18.PNG
5 feb15.PNG
2
1 jan8.PNG
3
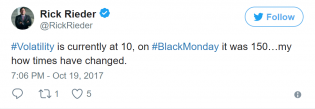
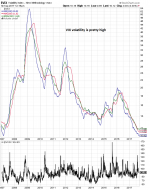
Résultat de recherche d'images pour "VIX"
When you include the 87 crash you can see how dumb a VIX below 10 was in 2017 2018!
1
2 dec6.PNG
9 aug31.png

8 aug31.png
1 aug22.png
4 aug20.png
1
1 july31.PNG
1
2 july7.PNG

9 june15.PNG
1
6 june15.PNG
4 june13.PNG
2 june12.PNG
6 may23.PNG
8 may18,.PNG

2 may3.PNG
1 may1.PNG

5 apr30.PNG
I'm posting this very good documentary about the LTCM crash/FED bailout again for those that haven't seen it yet....
1

6 apr25.PNG

1 apr25.PNG
11 apr24.PNG
4
![2018-04-23_9-26-50[1].jpg](https://s3.amazonaws.com/cdn2.socialtrade.com/st/shards/22331_OfeTqmGy_h)
2018-04-23_9-26-50[1].jpg
1 apr23.PNG
2

1 apr16.PNG
1

1 apr11.PNG
1 apr5.PNG
8 mar30.PNG

8 mar29.PNG
2

7 mar29.PNG
5 mar23.PNG

4 mar23.PNG
3 mar23.PNG

2 mar23.PNG

1 feb16.jpg
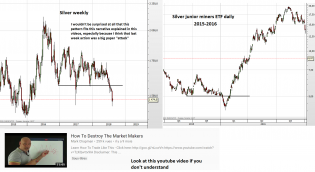
https://www.youtube.com/watch?v=6WQjgHuUDWU
1
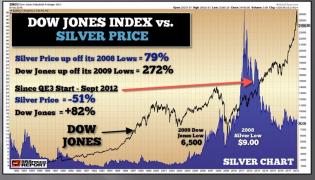
silver.jpg
Dow Jones v Physical Silver. Make of it what you will. I'm not speculating/forecasting what happens next.

5 feb9.jpg
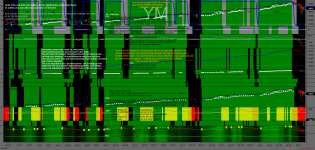
http://www.tradegato.com/gallery/albums/TradeGato/YM-03-18-240-Minu...
@TK I 'luff' it. 'Wait for it'
@FoamRanger
(This guy's chats is a really great addition to MySlopeCharts.
Plea...


shorts.png
How much short-vol is out there?
From Macrovoices podcast with Chris Cole of Artemis

1
6 jan10.PNG
What a surprise! And I can only imagine for silver!!!
Big pockets clearly fear to be suicided if they buy some #p...
2

5 jan5.PNG

4 jan5.PNG
5 jan4.PNG
4 jan4.PNG
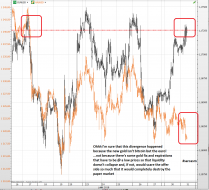
It is the 1990's but on steroids thx to the explosion in exotic derivatives and negative real interest rates in al...
6 jan3.PNG
It seems that it's gonna close to an all time low again!

2 jan3.PNG

Newton-Gets-Poor-2017-02-22.jpg
Sir Isaac Newton traded bubble mania. Credit to https://www.peakprosperity.com/blog/113504/youre-just-not-prepared-wh...
2

bubble.gif
$BTC mania versus Silver mania
2
8 dec1.PNG
6

1 nov14.PNG

2 nov12.PNG

1 nov9.PNG
Who's right?
4
10 nov8.PNG

7 nov8.PNG
3 nov8.PNG
4 nov5.PNG
3 nov5.PNG
7 nov2.PNG

2 nov1.PNG
1 nov1.PNG
Bulls wipe out is already written
But we still gonna ear "who could have seen it coming" everywhere once it's too...
1

SPXL.jpg
Bearish engulfing on $SPXL during island top. Bearish crossover on MACD. Not inferring anything. Just saying. http...
10 oct23.PNG
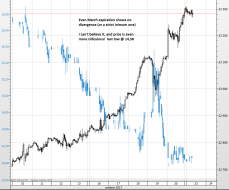
May be the divergence I was expecting for
Really minium one
1
5 oct23.PNG
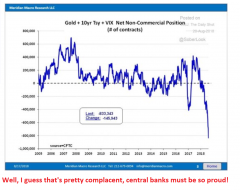
Complacency at all time high!
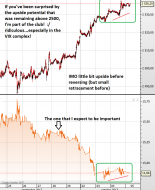
2 oct20.PNG
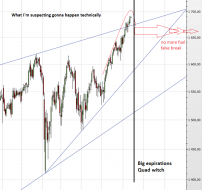
What I'm expecting for

1 oct20.PNG
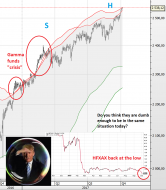
You think they know it?
1 oct19.PNG
Lol, ready to break that before the end of the decade?
Wait... maybe they are gonna stop rigging gold to prevent...

3 oct12.PNG
6 oct5.PNG
1
4 oct5.PNG
2 sept25.PNG
Ok, wich one is right?
5 sept21.PNG
7
4 sept20.PNG

3 sept20.PNG
Lol, and it's supposed to be a free market
3
5 sept19.PNG
4 sept19.PNG
2

2 sept15.PNG

2 sept14.PNG

1 sept14.PNG
Bear gonna FINALLY wake up!!!
4
gold.jpg
MONTHLY CHART FOR SPOT GOLD. IMPORTANT TRENDLINE CROSSED A FEW HOURS AGO. Price may follow the trend downwards a l...
3
gold.jpg
Bull flag channel formed on spot gold after North Korea's nuclear test. Suspect that S3 pivot will be tested down...
3
GDX_8-9-17.png

1
slopechart_GAZ.jpg
What a GAZ
4 june1.PNG
1
1 june1.PNG
1
1 may31.PNG
1 may25.PNG
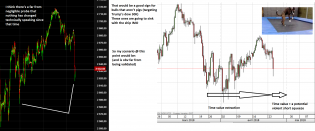
If you are a buyer look @ this!
If you are a seller... well... odds are on your side but the "market" doesn't car...
2 may24.PNG
About 5% lost since may16 close
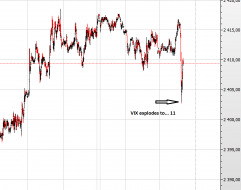
![20170518_vol[1].jpg](https://s3.amazonaws.com/cdn2.socialtrade.com/st/shards/20156_dkfZewKi_h)
20170518_vol[1].jpg
Volatility coming...