Users: Amy: MarketTech Reports: Market Top Indicators - VIX
MarketTech Reports: Market Top Indicators - VIX
Continuing the indecisiveness trend over the last week, the market today refused to rise or drop by any significant amounts. As mentioned
yesterday, there are several signs the market looks to be approaching a peak. Lets take another look: the VIX.
As most are aware, the VIX volatility indicator has a great correlation in the last few years to the stock market peaks and bottoms. Low volatility readings has almost always indicated a local peak in the S&P. Below is the VIX for the last 2 yrs. There has been approximately 5 times in the last 2 years where the VIX has fallen to a reading of ~15, circled in blue. (2011 - Feb, May, July) (2012 - Mar, Aug)
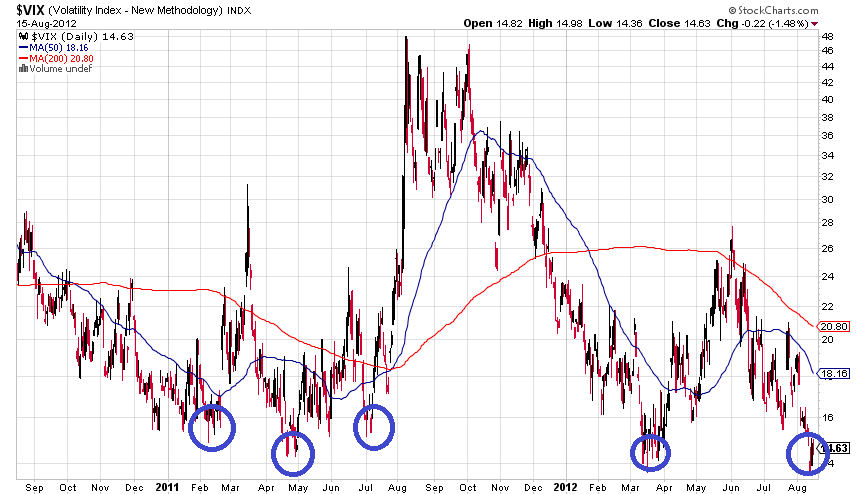
Below is the S&P 500 index for the same period. Each of the 5 lows in the VIX marked a local high.


Based on the VIX indicator, there exists a significant chance that the market is at a local high. What is particularly compelling here is that the indicator has been very accurate and in each case, was followed by a large drop of >6%. If the trend holds, a drop may start within the next few weeks. Also interesting to note, each drop took an average of approximately 2 months to bottom out.
Comments
 Sanddollar

