Users: HitGirl: SP_Apr_15.png
SP_Apr_15.png
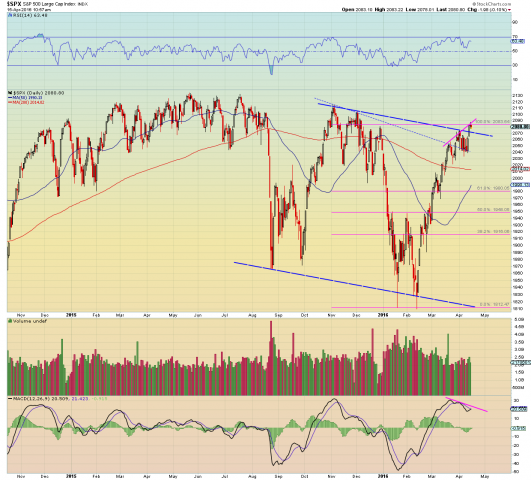
Update of a chart first posted in Feb, updated in Mar treating the mid Jan to mid Feb period as an intermediate double bottom w/ target of 2082. We overshot to 2083, however, there is now negative divergence on the daily chart supporting the argument for a down leg.
Moving to the S&P weekly, what looked like a possible bull flag from mid 2015 to present is looking more like a down channel given the above, and also given that volume increased as price fell. There was also a bearish MA crossover on the monthly similar to ones that took place early in the '01 and '08 bear markets.
Lots of indicators, now just need to see a sustained price move down....
Comments
No comments yet.
...