Users: moneymiser21: Ford_Monthly_Daily_May012015.jpg
Ford_Monthly_Daily_May012015.jpg
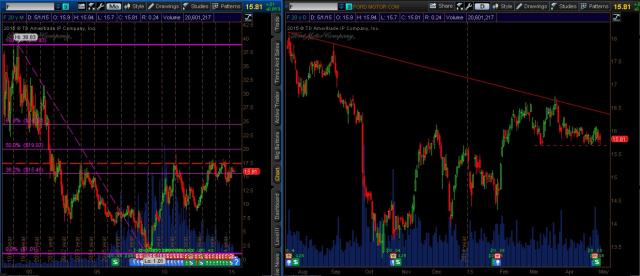
Poor auto sales numbers today put Ford on bear watch.
Monthly chart shows Ford failing to hold trade above $17.50 since the low in 2008. And it could not reach a 50% retracement from the April 1999 high.
The daily chart shows Price rejecting downtrend line off the July 2014 high.
A daily close beneath $15.68 (red dotted line) would confirm the bear pressure increase, and short potential.
Target #1 would be the gap at 15.27.
Target #2 $14.50, just above the support zone that begins at 14.46.
If the larger monthly downtrend holds, $12.50 is in play.


target one was achieved.
Now for t2 5/20/15