Browse Stacks: Analytics: Elliott Wave: GDX.png
GDX.png
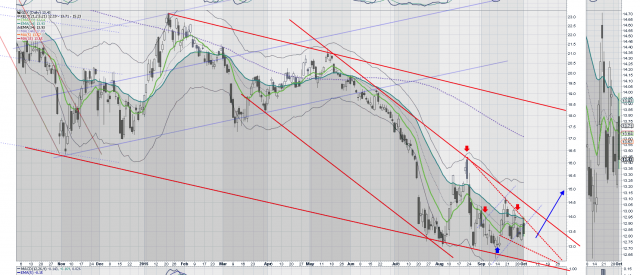
GDX appears to be currently in a large downward channel that started back in November and looks set to begin the third wave up (of a larger five way down pattern). Point-and-figure charts have the high at around $18.30 which is the upper resistance line of my channel. This third leg up appears coincident with a bullish declining wedge that we've noticed developing since about mid-August. Gold miners are looking like a good buy at the moment although I am having trouble putting this proposed climb in the context of the larger market.
Comments

...


1) Declining or sideways action in gold. Very long term downtrend continues
2) Overall market action has been unfavorable for the bulls over the past 8 weeks.
3) Very strong support area at $13. A break below that would be devastating from a technical perspective, IMO
Good luck. Thanks for sharing. 10/1/15