Browse Symbol Stacks: FXI
slopechart_FXI.jpg
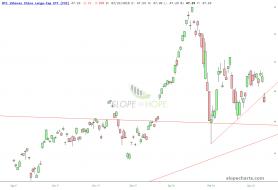
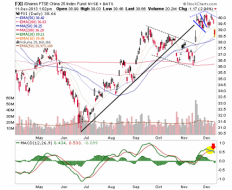
levels to watch
volume, oh my

1
slopechart_FXI.jpg
Most hated
1
slopechart_FXI.jpg
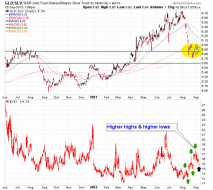
China - higher lows?

1
slopechart_FXI.jpg
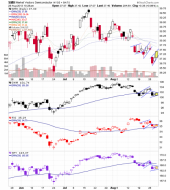
Plenty of room
slopechart_FXI.jpg
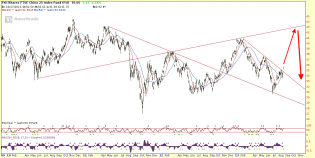
next: resistance at 26.73
slopechart_FXI.jpg
FXI breakout commencing
3
slopechart_FXI.jpg
another breakout attempt - will it work this time?
1
slopechart_FXI.jpg
Is it going to break out from the down trend line?
slopechart_FXI.jpg
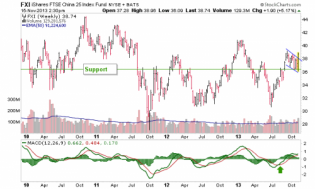
Resistance turned into support
slopechart_FXI.jpg
trendline breakout

slopechart_FXI.jpg
FXI - For now there is a positive island reversal. But if price falls below the top blue line from 2016, I think...

slopechart_FXI.jpg
China

ashr fxi
We've been tracking the China A-shares out performance to large caps for a while now and it was a good bull signal.

1
slopechart_FXI.jpg
China ETF - 50 large cap Chinese companies, but when I see "FX", I think of Forex: FXY, FXE, etc., not equities....

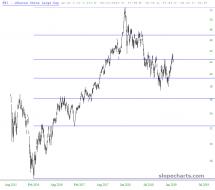
vs. SPY | Notes From the Rabbit Hole
China large caps vs. US large caps (SPY).
slopechart_FXI.jpg
Targeting $40 then $38 ish
That's right @MS and I agree on China. For very different reasons, of course.
Interest...

4
slopechart_FXI.jpg
See Activity Log for Bully Deletes:
https://slopeofhope.com/page/social-trade.html#activity
Every Day the ev...
slopechart_FXI.jpg
Every Day the evil one in the White House can't get out of his own way. The entire GOP are bowing to a moron. Read...
slopechart_FXI.jpg
Every Day the evil one in the White House can't get out of his own way. The entire GOP are bowing to a moron. Read...
1
slopechart_FXI.jpg
FXI surge after G20 weekend
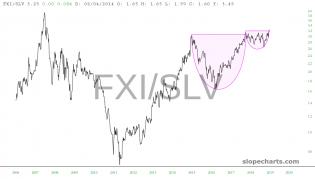
slopechart_FXI/SLV.jpg
WAG - silver flops around while China goes blow off top?
slopechart_FXI.jpg
Fireworks or duds on Monday?
1
slopechart_FXI (7).jpg
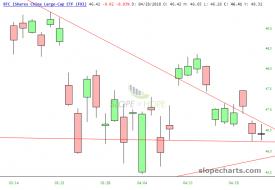
Schrodinger's ETF: iShares China Large-Cap (FXI)

3
slopechart_FXI.jpg
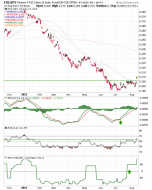
China ETF fell below long-term support today before rebounding. Looks headed for a breakdown.
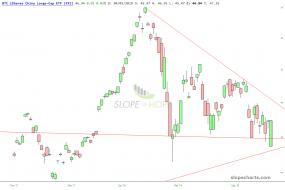
slopechart_FXI (7).jpg
China (FXI) trendline broken.
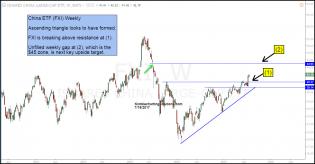
fxi-ascending-triangle-breakout-next-target-unfilled-gap-july-19...
China ETF (FXI) in 2015 started falling hard. While it was doing so, it left a “large unfilled weekly gap” on...


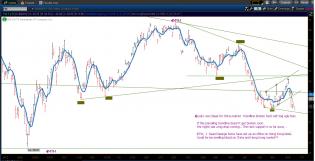
China - Daily - 8.25.16.png
China - daily chart. This is not investment advice.

6

FXI - Daily - 6.28.16.png
FXI daily. This is not investment advice.
3
China - Daily - 5.17.16.png
China daily. This is not investment advice.
5
HK 15.02.16.png
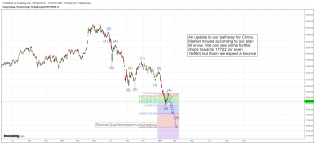
An update to our projected pathway for China

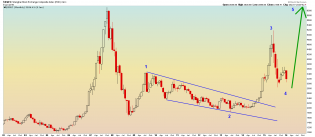
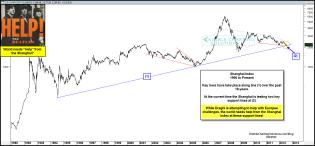
China Monthly - 1.11.16.png
China Monthly. This is an opinion.
9
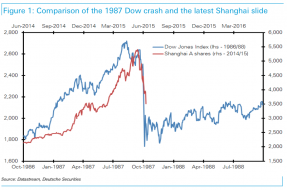
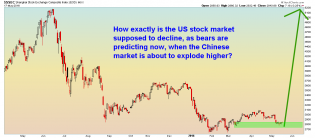
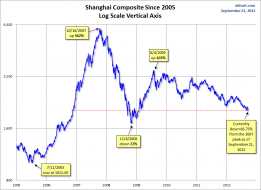
SHCOMP1987.png (802×530)
Comparing the Dow 1987 crash with China today
2
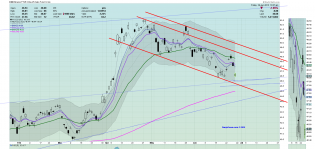
China.png
The Chinese ETF FXI is now firmly in a declining channel. The Shanghai index fell 8.3% this morning after the cent...

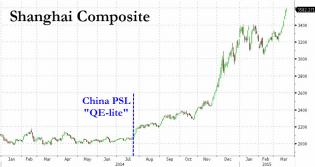
20150319_shcomp.jpg (954×506)
Chinese stocks going bananas
2
fxi
China 25 drops from a messy short term pattern.
fxi
China 25 breaking consolidation flag above support.
gsr.vix
Market made me capitulate and book loss on SPY puts yesterday. Today these bearish indicators beneath the surface...
smh
Stock markets beginning to look like HUI circa Q4 2012 w/ bear flags forming in a new downtrend. Below EMA 50's U...
fxi_081213.png
FXI had a bullish breakout from a six month descending trendline today.

fxi.spy
FXI-SPY ratio breaks out above resistance and 50 day avg's. Trend change for China 25 over SP 500 looks likely.
1
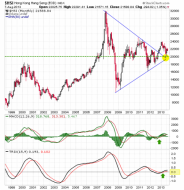
hsi
Hong Kong Hang Seng... Big picture bullish symmetrical triangle or double top @ 2400? Monthly MACD & TRIX think it...
content.screencast.com/use.../FXI71113.gif
FXI trendline backtest

chinafxistrongoflatedec10.gif (1574×727)
While the media seems focused on the "Fiscal Cliff," are investors getting distracted from a "Fiscally Strong perf...
shanghaichinaetfconfusingdec51.gif (1574×730)
The Shanghai index has been fairly weak of late and broke several support lines recently. Today the Shanghai index...
shanghaibreakdownmay25.gif (1573×726)
Could the Shanghai index fall 28% again? Impact U.S. broad market?
20121024_china.png (721×384)
It appears once again that the behavior of a liquidity-constrained high-beta market-price is encouraging excitemen...
chinastrengthresistancetestoct17.gif (1576×730)
fxibreakoutwouldbepositiveoct10.gif (1575×727)
shanghaineedsbounceoct4.gif (1577×729)
dshort Featured Charts

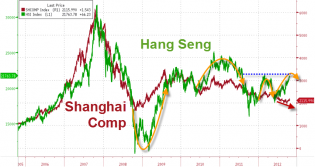
hangsengchinaknockingonresistanceaug151.jpg (1559×663)
China and Hang Seng up against resistance
dshort Featured Charts
Shanghai index is dangerously close to breaking its trendline
The Shanghai Tower and Aftermath: New Update
Population pyramid for China - "In developed countries, the peak earning years are ages 45-54, with the 45-49 coho...
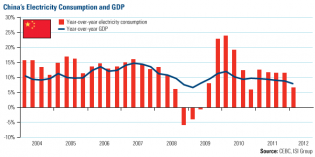
China's Electricity Consumption and GDP

China market updates 25 June.jpg

Investing in Chinese Stocks—投资大中华地区股市
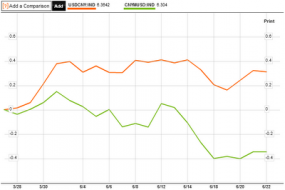
Daily chart: China in your hand | The Economist
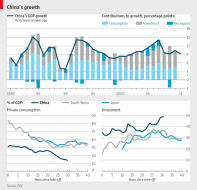
The myth of Chinese growth
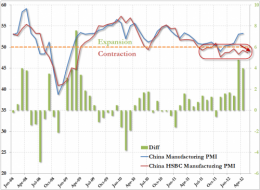
China HSBC Flash PMI Declines, Economy Now In Contraction For 10...
China is contracting still!
1
563873_10150640036384149_691899148_9114125_1918953365_n.jpg (667×477)