Log In
|
Create Account
Chart
AI Chart Analysis
Chart Lab
Drawn Objects ➟
Earnings Reactions
Guide to Patterns ➟
Modes ➟
Power Features ➟
Rotation Graphs
SlopeCharts
Yield Curve
Equities
Biggest Stocks
Calendar of Earnings
Correlations
Earnings ➟
Historical Earnings
Market Capitalization
Power Screener
Super Summary
Volume/Price Leaders
Woulda Shoulda
Markets
CryptoStream LIVE
Economic Database
Global Economics
Heatmap
Macroeconomics
Market Meter
MetaSymbols
Quad Matrix
SlopeRules
Watch Lists
Options
Analytics ➟
Backtest Strategies
Earnings Calendar
Extreme Options
Historical Charts
Matrix of Volatility
Open Interest & Volume
Payoff Analyzer
Strategy Explorer
Volatility Calendar
Read
Automatic Reports
Best Posts of All Time
Books by Tim Knight
Guide to Comments
Latest Posts
Mobile Apps
Profile of Your Host
Recommended Books
Ticker Stripper
Trading Rules
Social
Browse Chart Database
Comments Search
Hall of Fame
Members Directory
Publishing/Subscribing
Recent Activity
Search SlopeRules
Shared Labels & Lists
SlopeTalk LIVE
Trader’s Diary
Help
Best Pages for You
Charts Overview
Guide to the Site
Membership Levels
Pattern Video Library
Power Screener Guide
Premium Memberships
SlopeCharts Reference
SlopeCharts Videos
Video Tutorial
Log In
Create Free Account
Memberships
Users
:
jungletrader
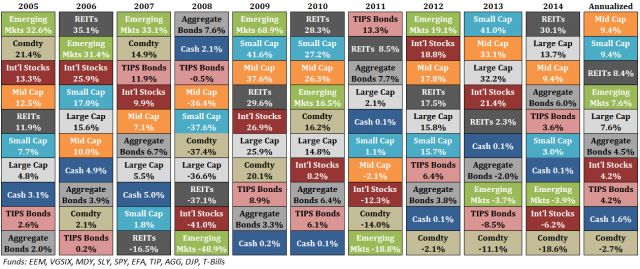
: Asset-Quilt1.png
Asset-Quilt1.png
http://awealthofcommonsense.com
See Full Size
Comments
ammo
look at the reits from 06 to 07, look at 2014,if we drop in reits hard this year, may be a tell for 2016
1/4/15
Alpha Dart Monkey
Very useful view. Thanks for sharing.
1/4/15
moneymiser21
I love the alternative view approach this provides.
Most useful indeed for fund flow analysis.
1/4/15
AK-Steve
This is a great piece of work, thanks.
1/4/15
...
Actions
Tweet
Facebook
Stacks
Breadth
Economy
ETFs
Fundamental
Predictions
Seasonality
Posted
By:
jungletrader
On:
1/3/15 6:32PM
Statistics
Viewed by 49 SocialTraders
Average rating based on 2 responses:
Rated By
 ammo
ammo