Browse Stacks: Analytics: Breadth
slopechart_SPY.jpg

2
GPC1230243.png (620×376)
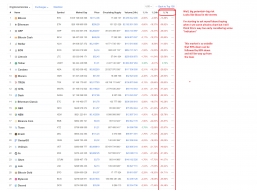
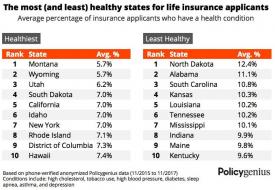
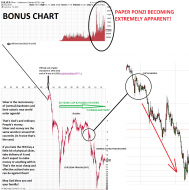
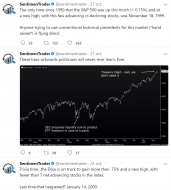
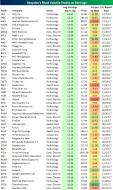
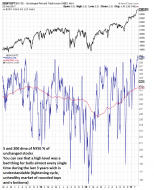
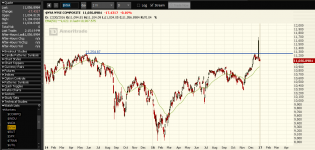
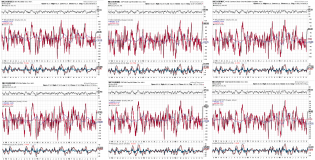
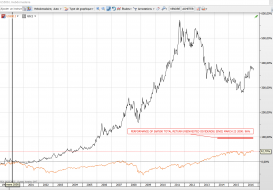
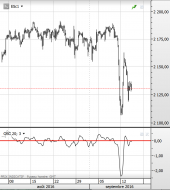
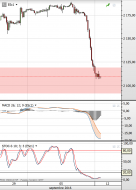
Put simply, the only reason the S&P 500 is holding up is due to a handful of large tech plays that receive a tremendo...

1
bfmF0A.jpg (936×595)
Bad Breadth
3
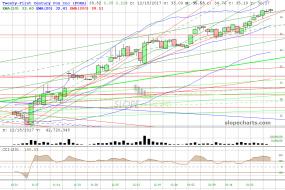
spx cap equal.jpg (1274×706)
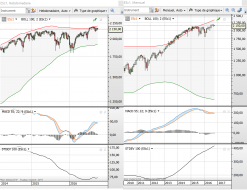
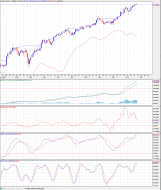
S&P 500 Index gained 1.6% last month, its equal-weighted counterpart slumped 0.9% (again).
Capture d'écran 2024-01-30 191558.png

Capture d'écran 2024-01-30 180934.png
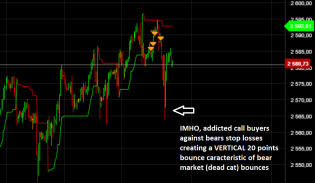
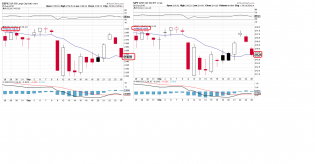
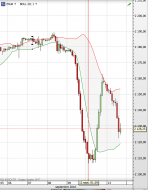
This is our market today! ALL a volatility trade.
As structured products supply so much vol it pins the index an...
Capture d'écran 2024-01-22 033551.png
Some food for bears
1 jan12.PNG

1 jan11.PNG
2
Imgur: The magic of the Internet
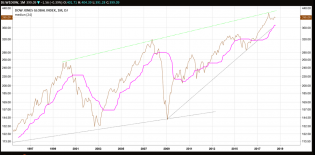
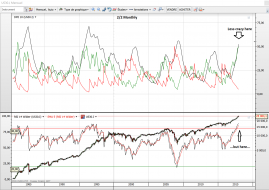
DJ Global Index with 2 year median. Globally market valuations have not recovered to previous highs. Global equi...
Imgur: The magic of the Internet
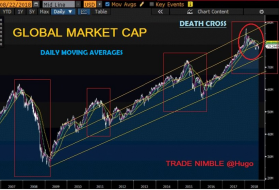
Death X marks the trend in global market cap
3 aug17.png
2 aug14.png

5 june15.PNG

9 june13.PNG
3
1 june1.PNG
4
4 may18,.PNG
10 may17.PNG
9 may17.PNG
1
8 may17.PNG
Rosenberg: S&P "Should Be 1000 Points Lower Than It Is Today" |...
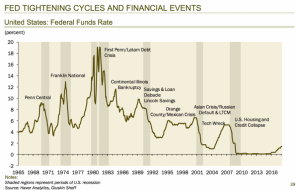
In other words, we are in the middle of the Fed tightening cycle. As history shows, a tightening cycle is almost a...
1 may14.PNG
1 apr27.PNG
1
5 apr26.PNG
4 apr23.PNG
MOMO23.jpg
Momentum Indicator Warns OF STOCK MARKET DANGER

3
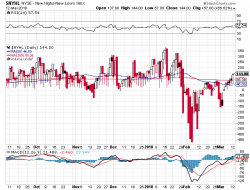
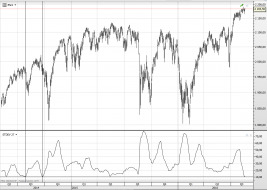
$NYHL.png
$NYNL market breadth

unnamed.png.jpg (786×542)
Thanks POTUS for finally trashing the market too. -2.0% so far.
Now your responsible for one of the largest ou...
14
slopechart_FOXA.jpg
Please, some moderator please delete this at some point.
Today the diagnosis came and my biggest fear was put to...
32
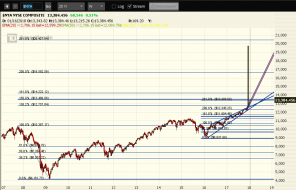
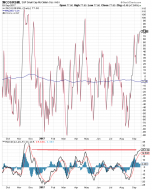
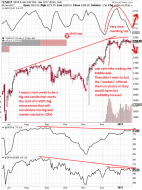
2018-01-19_$NYA.png
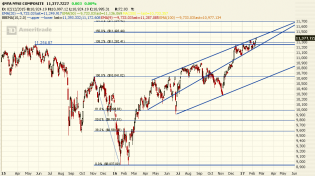
$NYA about to meet a confluence of Fibonacci extentions.
3
1 jan16.PNG
3 jan4.PNG
2 jan4.PNG
1 jan2.PNG
3
3 dec31.PNG
2 nov10.PNG
2 nov8.PNG
1 nov6.PNG
3 nov1.PNG
2
2 oct31.PNG
omg I can't believe what I see
IMO we could see a short term bounce or a small leg up to get out of oversold envi...
SPXfutures.jpg
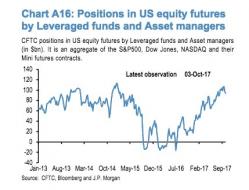
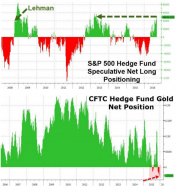
Hedge funds and asset managers haven't been this net long US equity futures since 1Q15
hedgehogs&therutty.jpg
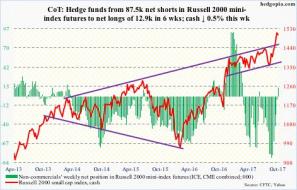
For 1st time in 17 weeks, #hedgefunds net long $RUT futures, even as cash showing signs of fatigue after huge run. $IWM
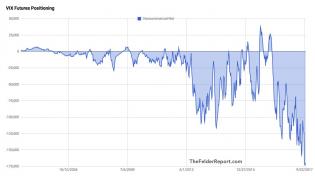
VIXfutures.jpg
Another new record in noncommercial net shorts in $VIX futures: Expect zombie-like action until a geopolitical cat...
4
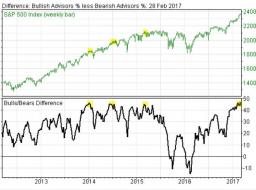
SPXweekly.jpg
Other times since 2009 that newsletter bulls-bears spread was >45%. Last time was March ($SPX fell 3% during month)
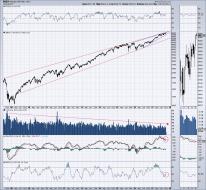
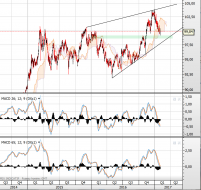
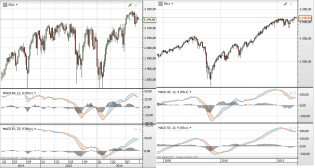
NAS100.jpg
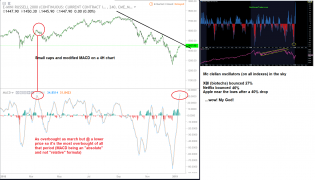
Nasdaq 100 weekly divergence stacking up.
MACD, money flow, volume.
Rising wedge formation
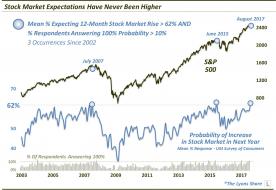
expectations all time high.jpg
A record percentage of people think the stock market will rise over the next 12 months
2
MChammer.jpg
The stock market has become excessively calm and quiet, befitting a meaningful top.
2
highestVOLearnings.jpg
Highest VOL post earnings report
2 sept19.PNG
Overbought small caps
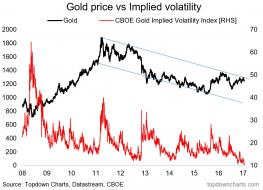
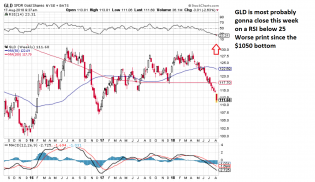
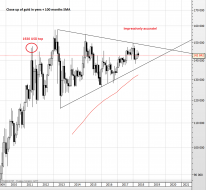
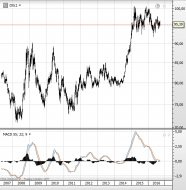
GOLDvol.jpg
Gold's volatility has fallen to the lowest level in half a decade. A big move is coming.
2
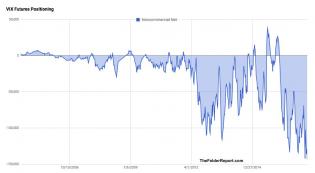
VIX.jpg
New record in non-commercial VIX shorts
2
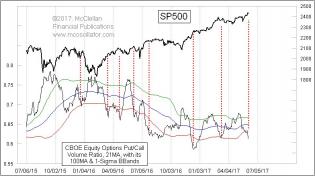
putcallratio.jpg
CBOE's Equity Put/Call Ratio 21MA is below its lower band, working without a net Q2 quad witch.
2 may26.PNG
Bullish?
2
1 feb26.PNG
Logic? in your opinion?
6 feb25.PNG
5

3 feb25.PNG
Huge!
2017-02-12_$NYA.png
4 feb9.PNG
What a surprise! again!
2
2 feb9.PNG
What a surprise, a "market" breathing by his a..
Fits perfectly in my scenario so far
1 feb8.PNG
GDX in full momentum but that's looking more like an other bull trap than a reversal IMO
2
1 feb5.PNG
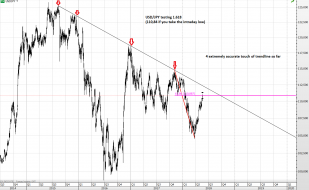
US dollar index continuous
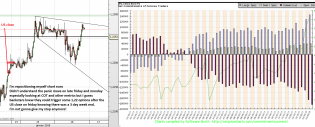
I think this is just a breath/buying opportunity in an uptrend
IMO there is a nice...
1

1 jan24.PNG
1 jan22.PNG
I'm back, happy new year guys!
Because I think this is it! ...finally!!!
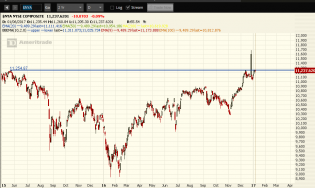
2017-01-06_NYA.png
$NYA still unable to close all time high.
1
2016-12-30_$NYA.png
Failed bullish breakout by $NYA.
1
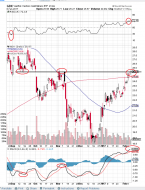
ESummation.png
Summation index making a bearish MA cross well above the 200 day. I will be avoiding new long positions until it c...

2
6 nov28.PNG
First 2H sell signal since elections
1
3 nov17.PNG
I mean... isn't what U should expect before a crash?
4 nov16.PNG
Short squeeze driven move?
Time will tell but I believe that was the case and is logic to me
4 oct3.PNG
4H chart
Long term MACD sell signal almost complete
STDEV big breath
Crucial time approaching
2 oct3.PNG
The combination of these 2 is IMO a big warning/problem
12 sept26.PNG
10dma reconnection
Closed just below on S&P cash and just above on SPY
9 sept26.PNG
Weekly and Monthly
8 sept26.PNG
6H chart update with MACD and long term MACD
4 sept25.PNG
Long term weekly MACD in dollar index clearly shows that huge breath.
A flat consolidation on a big breath like t...
3
3 sept25.PNG
Long term weekly MACD still on a buy signal (but obv lags more)
And market is completely unstretched contrary to...
5 sept17.PNG
2000 was the top of the kondratieff cycle
7
3 sept16.PNG
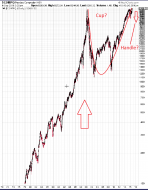
Russel2000's breath and patterns
1
2 sept16.PNG
And russel2000 still looks like an inverse cup with handle pattern consolidation
10 sept14.PNG
Another big move coming in the next few days (following expiration)?
1
8 sept14.PNG
ES Short term breath now relaxed
6 sept13.PNG
Amazon monthly
3 sept13.PNG
breath
11 sept12.PNG
10 sept12.PNG
This would be IMO the best zone for bears to consolidate the 2h frame without slowing the big momentum we are in r...
1
7 sept12.PNG
For these who understand what money is
1
9 sept10.PNG
Ya that definitly was too quiet
Extreme greed doesn't necessarily means blow off top with a nice V shape
6 sept8.PNG
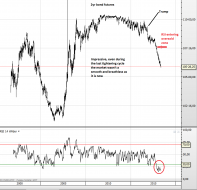
EUR/USD monthly
Long and flat breath since the bottom
Completely unextended now after beeing extremely stretched
11 sept7.PNG
Remember last december? when all these donkeys were the shortest on record concerning gold! ROFL...geniuses
5 sept6.PNG
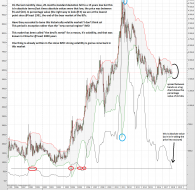
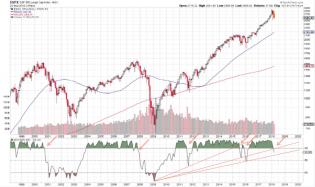
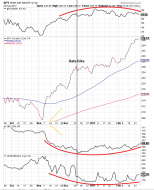
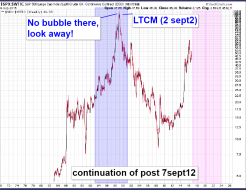
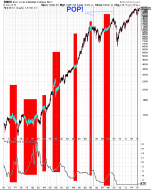
Thightening cycles of the fed
The last two easing cycles were correlated to a bubble poping...
...Blue line comming?
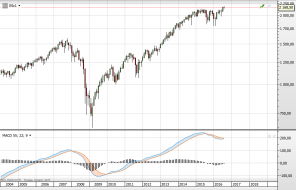
3 sept6.PNG
Nasdaq index since creation
5
4 sept3.PNG
One of the most important captures I'll post
I called it "the big picture"
I made it in 2014
@Dink, that's...
3
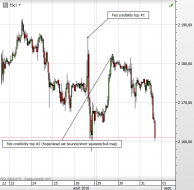
7 aug31.png
Target is bottom in fed credibility
I give you a hint... it's A LOT lower!
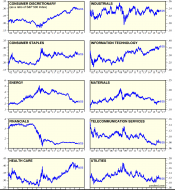
4 aug27.png
Sectors relative to S&P500
Lot of room for XLE, XLF, XLB, to outperform after all the sheeps had realized they we...
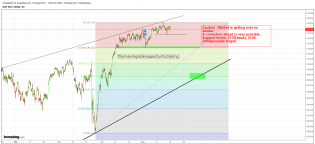
3 aug27.png
I think the last time we gonna see the price we are now (going above and never revisit it again) is gonna be in 20...
spx 19.08.16.png
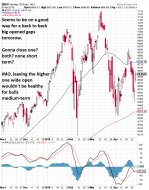
stall speed...

3
1 aug19.png
last two times we were at this level it didn't end well!
And at that time there still was QE even if it already w...
![20160818_open[1].jpg](https://s3.amazonaws.com/cdn2.socialtrade.com/st/shards/18199_P6YNo8hQ_h)
20160818_open[1].jpg
No comment...
7
3 aug16.png
Volatility of volatility closed an other gap yesterday
Two gaps left (last few months) higher
2 aug16.png
VIX original formula and it's ratio to VIX of VIX still are off the charts.
If you want the same with VIX new for...