
@Torero The analysis says that we have shifted into a new sell signal, and I listed the exact technical reasons why. However, there is also analysis of a few ETFs and stocks that are holding up (which were entered while still on buy mode).
These stocks and ETFs with relative strength are likely to be the first to move higher when the stock market breaks out.
Apologies if I didn't make that clear.
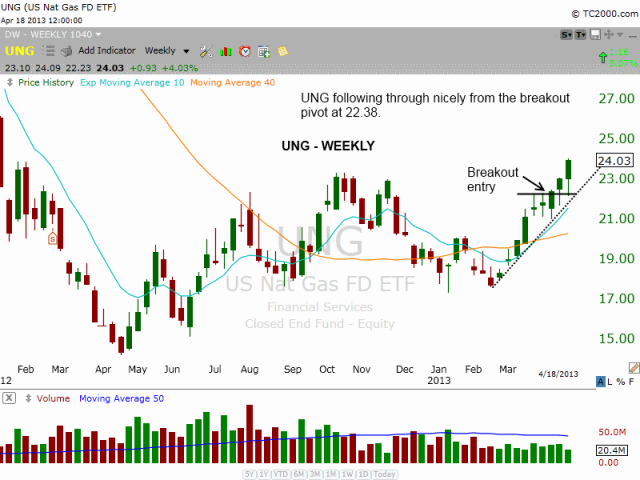
Browse Symbol Stacks: CLDX: $UNG WEEKLY chart
$UNG WEEKLY chart
Stock Market Breaks Down, As Two Of Our Swing Trades Breakout. This article is technical analysis of the current state of the S&P 500, as well as a look at a few ETF and stocks moving higher while the market moves lower.
Comments
...


what does your ANALysis say, BUY or SELL, no comprende.
I also have charts to look @.
4/19/13