Browse Symbol Stacks: ZN: 10 Year Bond Futures - ZN Weekly - 5.17.16.png
10 Year Bond Futures - ZN Weekly - 5.17.16.png
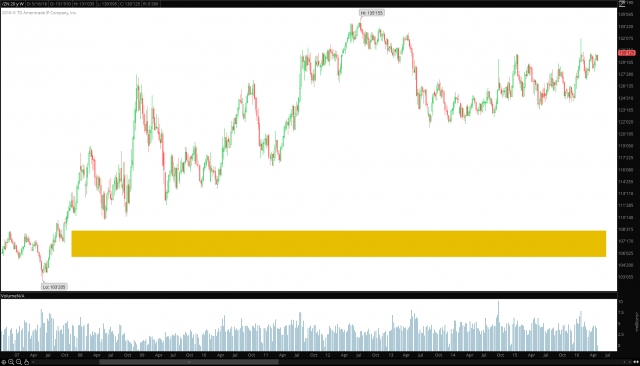
Weekly chart of ZN (10-year bond futures) in price,not yield. There has been a lot of talk about a continuation of bond prices up (lower yields). In some ways this is good for bond price bears like me, because during the top process, everyone has given up and jumps on the bull. Bond bulls have been using charts of yields to claim a cup and handle continuation is playing out. When you analyze stocks, do you use yields for your technical analysis? The bond futures is the actual instrument being traded and so we should be looking at those charts for analysis. Those with a keen eye will see in this chart a major top forming with downside projected to the yellow band, which hasn't seen since 2007. It looks to me like after this retest fails (either with a lower high below 135.155 or a marginal new high above there that doesn't hold), then price will continue in a second wave lower to continue the new bond bear market that should last a generation.
Comments
No comments yet.

