Users: Closing Basis - go with the flow: All Pages
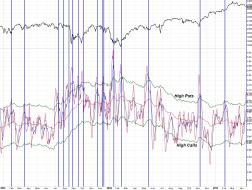
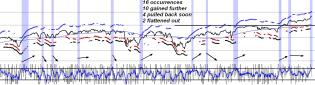
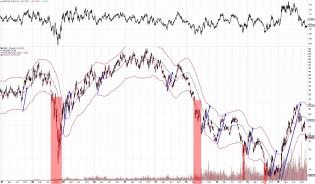
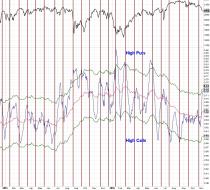
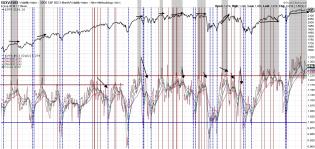
170414 - Equity Put Call - High Puts - Daily.jpg

2
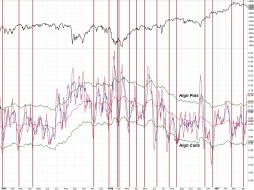
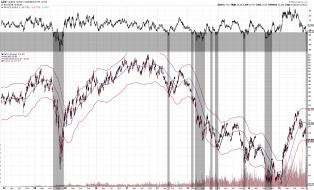
170414 - Equity Put Call - High Calls - Daily.jpg
3
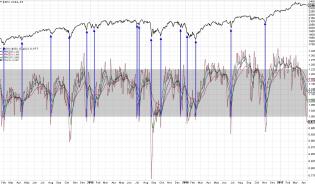
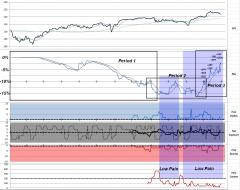
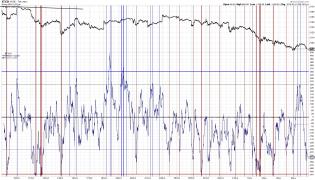
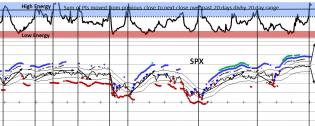
170412 - VXV VIX ratio suggests a low.jpg
1
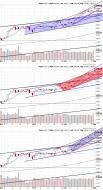
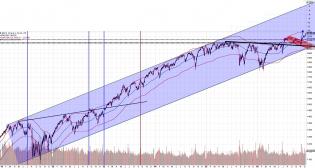
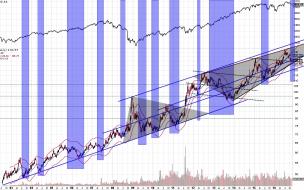
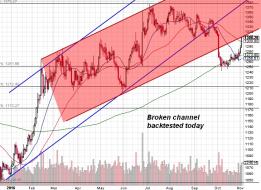
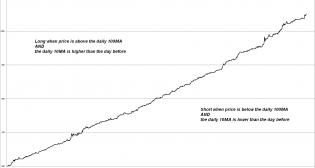
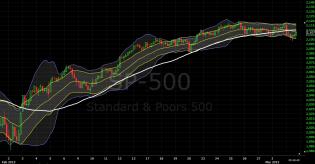
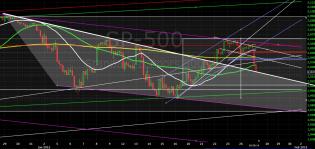
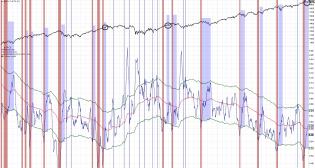
170301 - Parabolic Channels.jpg
1
170215 - 9 major SPDR sector agreement.jpg
1
170106 - Squeezed over 40Pcnt.jpg
1
161230 - EOY results.jpg
2
161220 - past nine Decembers.jpg
1
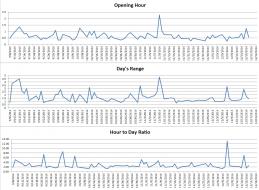
161219 - opening range study.jpg
1
161215 - GPRO 100-10 trend agreement.jpg
1
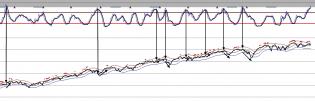
161214 - PutCall original marked.jpg
1
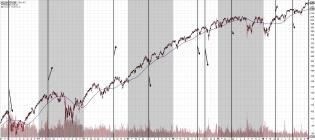
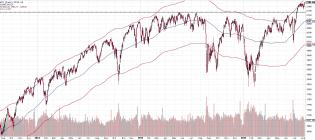
161208 - SPY 6yr daily chart.jpg
8
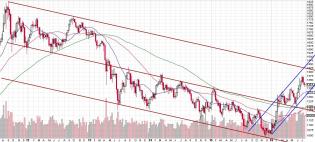
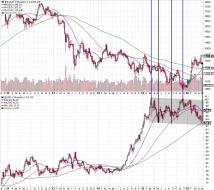
161205 - GDX 10years.jpg
4
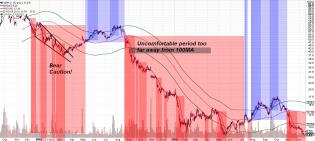
161117 - 20pcnt from 100MA bands.jpg
1
161104 - TICK 60min SMA 250 zone.jpg
1
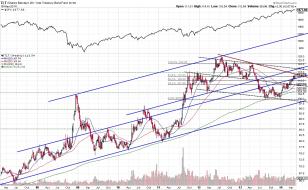
161103 - TLT long-term.jpg
2
161103 - Equities Only Put-Call Ratio with SMA envelopes.jpg
1
161102 - Gold daily chart.jpg
gold correlation to other markets.JPG
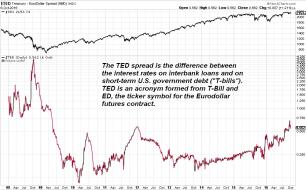
161007 - TED Spread.jpg
6
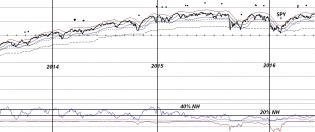
160908 - Low Relative Volatility.jpg
1
160906 - Highly Congested Market.jpg
2
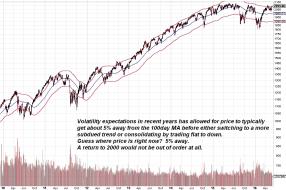
160805 - SPX 5pcnt above 100MA chart.jpg
4
160722 - Gold weekly channel.JPG
2
160715 - SPX hits 100MA 5% deviation.JPG
1
160708 - 100-10 agreement Profit Projection EOD only bias.JPG
2
160708 - 100-10 agreement Profit Projection.jpg
2
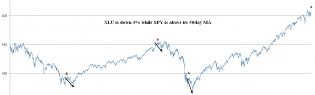
July 2016 XLU typical pcnt deviations.jpg
1
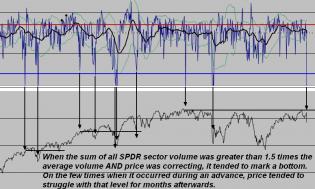
160625 - SPDR sectors cumulative volume.jpg
1
160617 - VIX study 2.jpg
1
160617 - VIX study 1.jpg
1
160617 - VIX study past 16 yrs.jpg
1
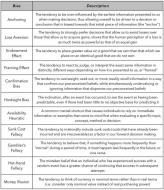
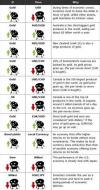
Cognitive Biases.JPG
160606 - New highs vs New Lows since mid-2013.JPG
1
160530 - SPX 100 MA deviation.jpg
1
160503 - Gold vs USD.jpg
042115 - JCarter Pcnt Squeezed.jpg
2
030315 - SPX hourly squeeze for 5 days.jpg
1
020715 - XLU condition.jpg
1
012915 - so far so good.jpg
1
012715 - SPX trend battle.jpg
1
080814 - Still no bearish sentiment.jpg
1
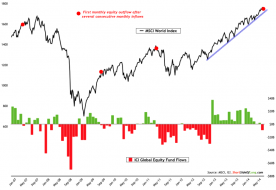
Equity-Fund-Flows.png
1
CPCE lower boundary rebounds - 2005 through 2009.jpg
1
071814 - Equity put call ratio returns from low boundary.jpg
2
070314 - Rydex Cash Investment Levels.jpg
2
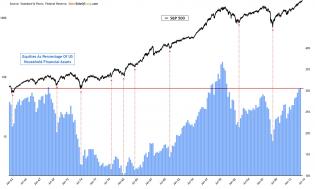
070314 - retail near highest invested cash percentage.jpg
1
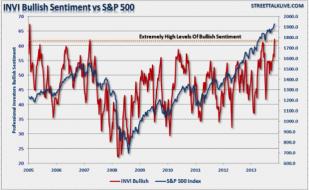
chs-investor-bulls-7-1-14.jpg

2
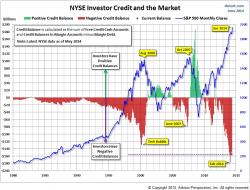
063014 - Investor Credit Levels.jpg
2
062014 - Advisors Sentiment.jpg
2
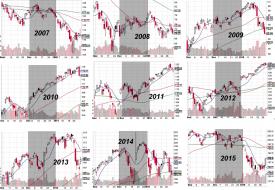
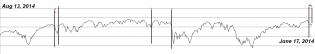
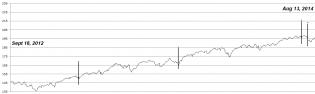
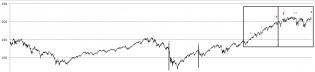
4 - Building from Low Volume Sept 2012 to present.jpg
3 - Building from Low Volume Periods 2011 through 2012.jpg
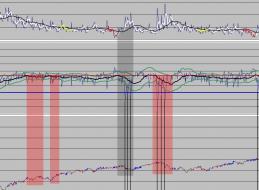
2 - Building from Low Volume Periods Mar 2009 through 2010.jpg
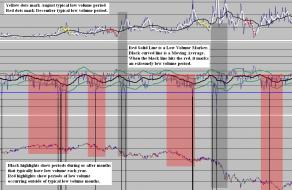
1- Building from Low Volume Periods 2007 through Mar 2009.jpg
1
051614 - TLT resistance.jpg
1
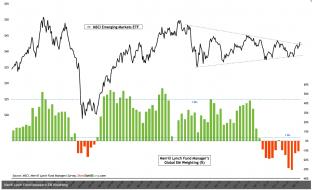
051614 - EEM potential.jpg
1
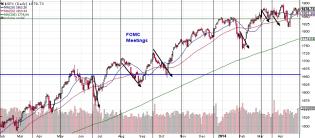
042914 - FOMC meetings.jpg
3
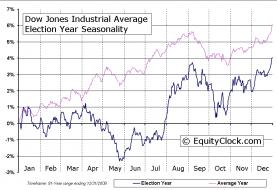
Yr4 - Election Cycle - Election.jpg
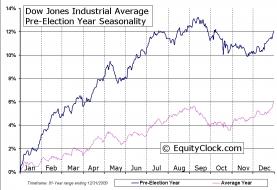
Yr3 - Election Cycle - Pre-Election.jpg
2
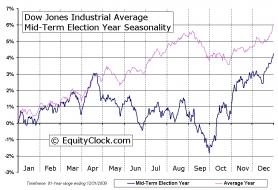
Yr2 - Election Cycle - Mid-Term.jpg
2
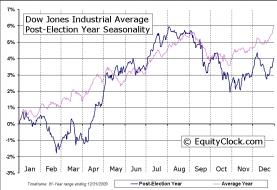
Yr1 - Election Cycle - Post-Election.jpg