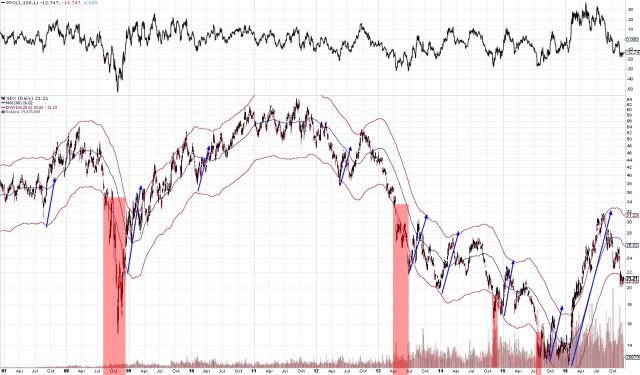
At least SOME of the big money works off longer timeframes than HFT's. They're big ships and it takes weeks to months to get into and out of position. As such, I use the 100day moving average (aka the 20 week moving average) and plot a typical deviation from that average. GDX tends to top and bottom around 20pcnt deviation from the 20week moving average. Sometimes, there is a crash, yes, but most of the time (count 'em) downside is very limited and outright rally potential increases. 12/5/16
There is a lot of activity on the chart and I find it confusing.
Honestly, I think Technical Analysis is a great tool for risk mgt. or finding opportunities. I think it is as useful as flipping a coin for predicting market direction. Maybe, I will be proven wrong at some point.
This is like 2008 or 2013 where real interest rates were rising and gold was not desirable. Oversold becomes more oversold until everyone is wiped out. We will see massive bankruptcies in the juniors given that many of these are scams, they are dependent on borrowing to keep operations going and many projects will not be viable at lower prices. 12/5/16
To outline the above. I have plotted a 100day SMA on the chart and added SMA envelopes set to 20%. Additionally, I highlighted in red areas when GDX just kept dropping anyhow and added blue arrows where there were rallies off of that level.
4 Drops (some of them fairly minor) 9 Rallies 12/5/16
 Closing Basis - go with the flow


