This was a simple indicator I put together last year for curiosity's sake. The dotted black line is a simple sum count of the main 9 SPDR sectors counting as a +1 if they're up on the day and a -1 if they are down on the day. So if most go up together on the day, it gives a count of 7 or more. That was a messy signal and didn't tell me much so I added a 5 day MA (the blue line) to make any clusters show up. I've highlighted times when the 5MA agreement was 7 or greater over 5 days.
16 occurrences 10 continued further and seem to be a sign of a buying surge 4 pulled back almost immediately afterwards, and 2 stalled out the SPY trend 2/15/17
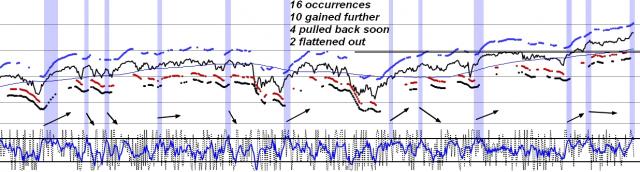


16 occurrences
10 continued further and seem to be a sign of a buying surge
4 pulled back almost immediately afterwards, and
2 stalled out the SPY trend 2/15/17