Users: Dink: All Pages
sc (1565×681)
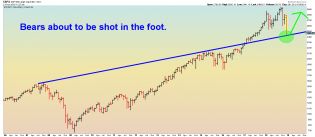
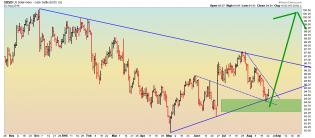
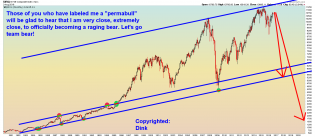
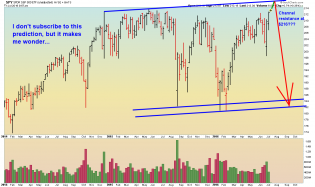
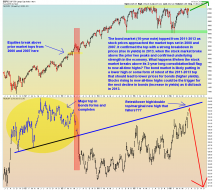
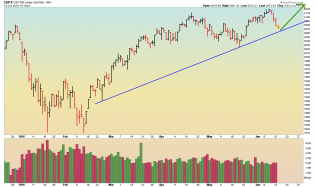
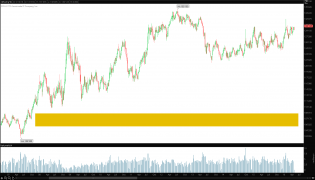
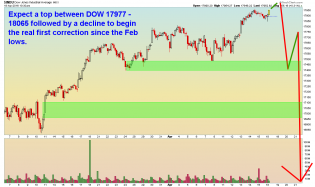
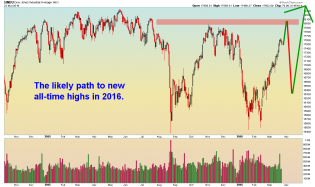
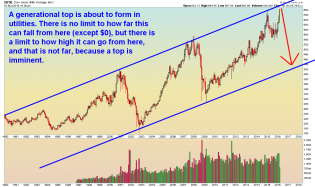
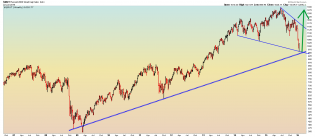
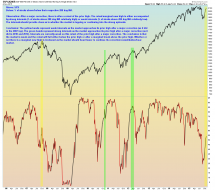
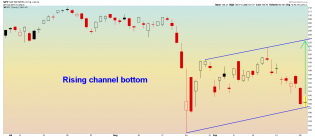
SPX - monthly.


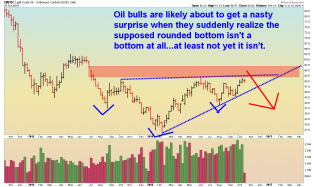
Oil - Weekly - 11.2.16.png
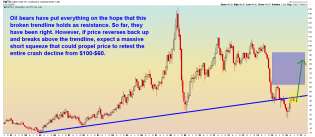
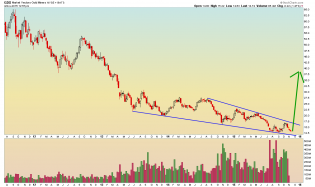
Oil - weekly chart. This is not investment advice.
5
Oil - Daily - 10.19.16.png
Oil - daily chart. This is not investment advice.
7
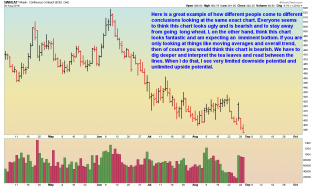
Wheat - Daily - 8.31.16.png
Wheat - daily chart. This is not investment advice.
8

China - Daily - 8.25.16.png
China - daily chart. This is not investment advice.
6
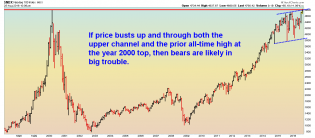
NDX - Monthly - 8.25.16.png
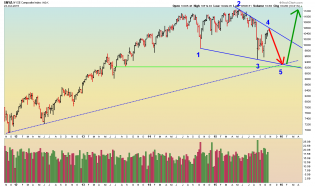
NDX - monthly chart. This is not investment advice.
2
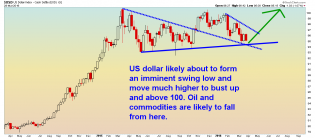
USD - Daily - 8.23.16.png
USD - daily chart. This is not investment advice.
1
SPY - Daily - 8.19.16.png
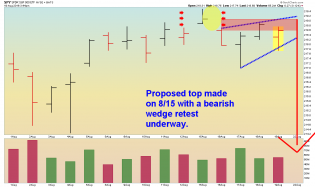
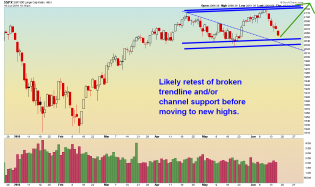
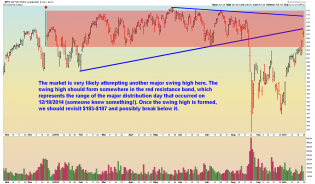
SPY - daily chart. This is not investment advice.
2

IBB - Weekly - 8.18.16.png
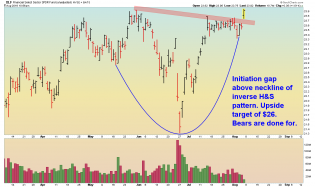
IBB - weekly chart. This is not investment advice.
1
GE - Weekly - 8.18.16.png
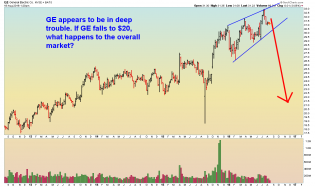
GE - weekly chart. This is not investment advice.
1

XLF - Daily - 8.17.16.png
XLF - daily chart. This is not investment advice.
1
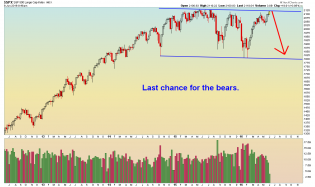
XLF - Daily - 8.5.16.png
XLF - daily. Bears had their chance and they blew it. This is not investment advice.
13
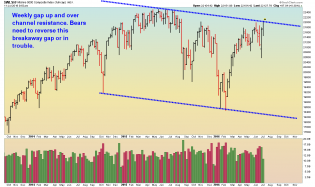
NYSE Composite - Monthly - 8.3.16.png
NYSE Composite - monthly. This is not investment advice.
5
$UTIL - Daily - 8.3.16.png
Utilities - daily. This is not investment advice.
1

VIX - 2 hour - 8.2.16.png
VIX - 2 hour chart. This is not investment advice.
2
IWM - Monthly - 7.29.16.png
IWM - monthly chart. This is not investment advice.
3
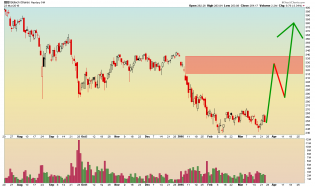
Oil - Monthly - 7.22.16.png
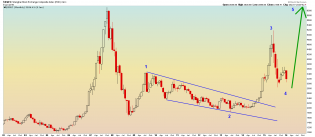
Oil - monthly. This is not investment advice.
9
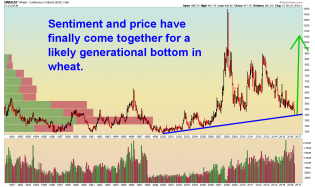
Wheat - Weekly - 7.22.16.png
Wheat - weekly. This is not investment advice.
5
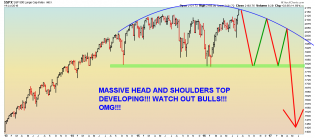
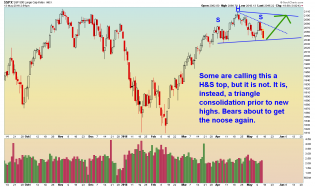
SPX - Weekly - 7.15.16.png
Sarcasm or not? You decide.
3
Wilshire 5000 - Weekly - 7.11.16.png
Wilshire 5000 weekly. This is not investment advice.
1
_SPY - Daily - 7.11.16.png
SPY weekly. This is not investment advice.
2
SPX and 10-year Note Prices - Weekly - 7.7.16.png
SPX (above) and 10-year note prices (below). This is not investment advice.
3
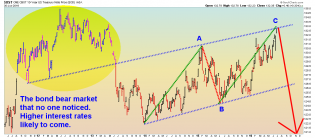
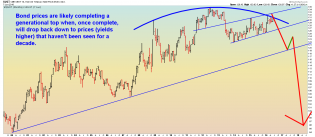
10-Year Bond Price - Weekly - 6.30.16.png
10-year bond price, weekly. This is not investment advice.
1

SPX - Daily - 6.28.16.png
SPX daily. This is not investment advice.
5

FXI - Daily - 6.28.16.png
FXI daily. This is not investment advice.
3

IWM - Weekly - 6.27.16.png
IWM weekly. This is not investment advice.
3

FTSE - Weekly - 6.27.16.png
FTSE weekly. This is not investment advice.
2
QQQ - Daily - 6.27.16.png
QQQ daily. This is not investment advice.
3

DB and CS - Daily - 6.17.16.png
DB and CS, daily chart. This is an opinion and not investment advice.
4

NIKK - Monthly - 6.17.16.png
Nikkei, monthly chart. This is an opinion and not investment advice.
3
DXJ - Weekly - 6.16.16.png
DXJ weekly. This is not investment advice.
4
SPX - Daily - 6.16.16.png
SPX daily. This is an opinion and not investment advice.
11
SPX - Daily - 6.14.16.png
SPX Daily. This is not investment advice.
12

TNX - Weekly - 6.13.16.png
10-year bond yield, weekly. This is not investment advice.
8
British Pound - Monthly - 6.9.16.png
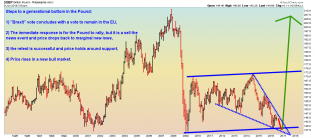
British pound - monthly chart. This is not investment advice.
11
Euro - Daily - 6.9.16.png
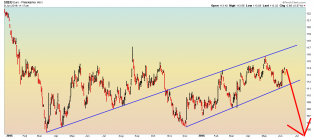
Euro - daily. This is not investment advice.
10-Year Note - Monthly - 6.8.16.png
10-year note prices. This is not investment advice.
1

USD - Monthly - 6.8.2016.png
USD monthly. This is not investment advice.
3
SPX Weekly - 6.8.16.png
SPX weekly. This is not investment advice.
3

NDX - Daily - 6.6.16.png
NDX Daily. This is not investment advice.
1

Copper - Daily - 6.2.16.png
Copper daily chart. This is not investment advice.
3
China - Daily - 5.17.16.png
China daily. This is not investment advice.
5
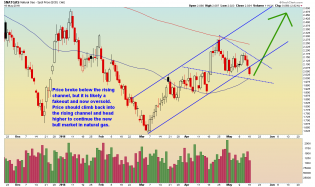
Natural Gas - Daily - 5.17.16.png
Natural Gas daily. This is not investment advice.
2
10 Year Bond Futures - ZN Weekly - 5.17.16.png
Weekly chart of ZN (10-year bond futures) in price,not yield. There has been a lot of talk about a continuation of...
SPX - Daily - 5.13.16.png
SPX daily. This is not investment advice.
8

VIX - Daily - 5.12.16.png
VIX daily. This is not investment advice.
5
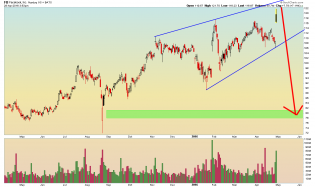
FB - Daily - 4.28.16.png
FB - daily. This is not investment advice.
1

NYSE Composite - Weekly - 4.20.16.png
NYSE index - weekly. This is not investment advice.
1
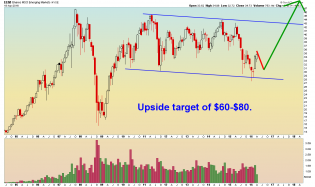
EEM - 4.18.16.png
EEM monthly. This is not investment advice.
2
DOW - 1 hour - 4.18.16.png
DOW, 1 hour chart. This is not investment advice.
2
Intermarket - Daily - 4.13.16.png
Intermarket. Daily chart. Market is likely about to top. This is not investment advice.
1
SPX - 2 hour - 4.13.2016.png
SPX 2-hour chart. This is not investment advice.
7
ES - Daily - 4.11.16.png
ES daily. This is not investment advice.
6
US Dollar - Daily - 3.30.16.png
US dollar, daily chart. This is not investment advice.
13
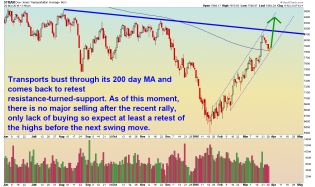
Transports - Daily - 3.29.16.png
Transports - daily chart. This is not investment advice.
US Dollar - Weekly - 3.24.16.png
US dollar - weekly. This is not investment advice.
1
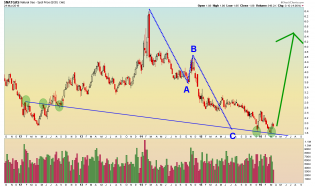
Natural Gas - Weekly - 3.24.2016.png
Natural gas - weekly. A generational bottom for this commodity is probably in with the recent swing low. This is n...
3
$INDU - Daily - 3.23.16.png
DOW - Daily. This is not investment advice.
6
IBB - Daily - 3.23.16.png
IBB daily. This is not investment advice.
3
IWM - Daily - 3.23.16.png
IWM daily. This is not investment advice.
Addendum added on 3.29 @ 3:00 pm EST: Massive distribution seen in in...
3
RSX - Weekly - 3.21.16.png
RSX - Monthly chart. This is not investment advice.
$UTIL - Monthly - 3.18.16.png
Utilities - monthly chart. This is not investment advice.
6
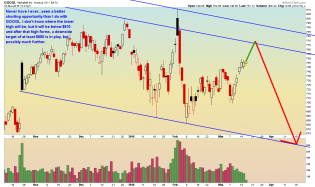
GOOGL - Daily - 3.16.16.png
Google daily. This is not investment advice.
3
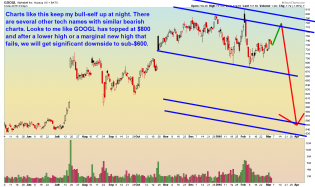
GOOGL - Daily - 3.3.2016.png
GOOGL daily. This is not investment advice.
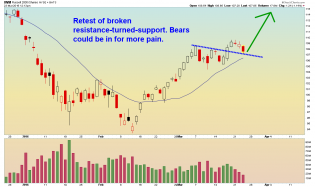
Russell 2000 - Weekly - 3.3.2016.png
Russell 2000 weekly chart. This is not investment advice.
4

UNG - Daily - 3.1.16.png
UNG daily. This is not investment advice.
4

TBT - Weekly 3.1.16.png
TBT weekly. This is not investment advice.
1

Natural Gas - Daily 2.25.2016.png
Natural Gas daily chart.
NDX Weekly - 2.10.16.png
NDX Weekly.
2
XLY Weekly - 2.10.2016.png
XLY weekly. This is not investment advice.
3
SPX Daily - 2.9.16.png
SPX daily. This is not investment advice.
7

Oil - Daily 2.9.2016.png
Oil daily. This is not investment advice.
2

SPX Daily - 2.8.2016.png
SPX Daily. This is not investment advice.
10
DOW - Weekly 1.27.2016.png
DOW weekly. This is NOT investment advice.
3
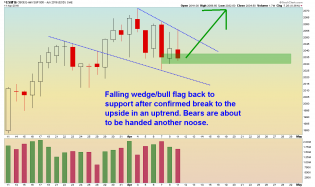
Russell 2000 - Weekly 1.22.2016.png
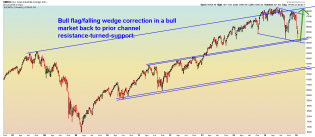
Russell 2000 weekly shows bullish falling wedge back to bull market trendline support. This is not investment advice.
5
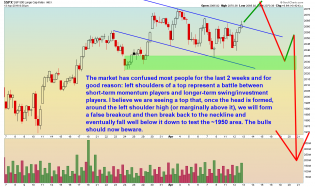
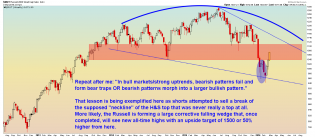
$SPX Weekly - 1.21.2016.png
Most likely scenario is this is similar to 2010. Next up should be rounded bottom shakeout and rise to new all-tim...
4
DJIA - Weekly 1.20.16.png
This is not investment advice.
2
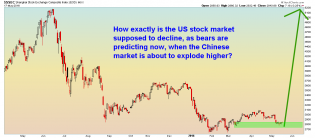
China Monthly - 1.11.16.png
China Monthly. This is an opinion.
9

VIX - 2 hour 12.1.2015.png
VIX 2 hour. This is an opinion and not investment advice.
6
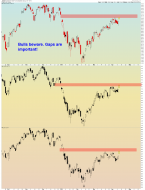
Stocks above 200 day MA - 11.5.2015.png
Weekly SPX (above) and % of stocks above their 200 day MA (below). Bulls are likely to be very upset soon. This is...
GDX - Weekly 11.4.2015.png
GDX weekly. This is an opinion and not investment advice.
4
NYA - Weekly 10.26.2015.png
NYSE Composite Weekly. This is an opinion and not investment advice.
8
SPY Daily - 10.23.15.png
SPY Daily - 12/23/2015. This is an opinion and not investment advice.
4
SPY daily - 9.29.15.png
SPY Daily. This is an opinion and not investment advice.
13
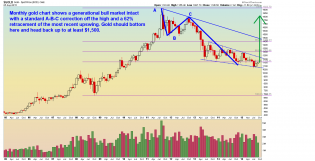
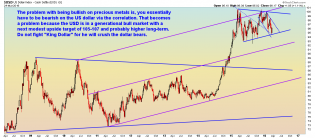
Monthly Gold.png
Monthly gold. (Obviously I misplaced the A-B-C, but I think people will get it). This is an opinion and not investmen...
1
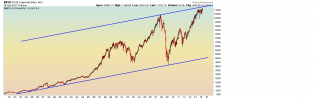
SPX Weekly - 9.22.2015.png
SPX Weekly. What are the odds that the market has topped and we are entering a bear market? Low. Why? Because most...
10
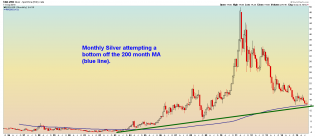
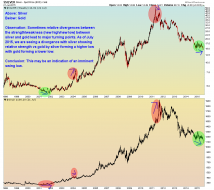
Silver.png
Monthly Silver. This is an opinion and not investment advice.
2

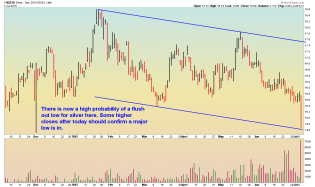
Silver - Daily 8.28.2015.png
Silver daily. This is an opinion and not investment advice.
9
Silver and Gold Weekly - 7.22.15.png
Weekly silver (above) and gold (below). This is an opinion and not investment advice.
1
Silver Daily - 7:7:2015.png
Silver daily. This is an opinion and not investment advice.
NYSE Monthly - 4.16.15.png
The only long-term chart that matters. Monthly NYSE - 4.16.15
1
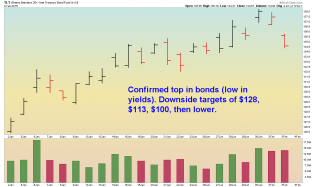
TLT Daily - 2.3.2015.png
TLT daily. This is an opinion. This is not investment advice.
2

Daily QQQ - 2.1.2015.png
Daily QQQ. This is an opinion. This is not investment advice.
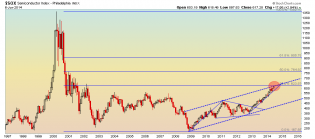
SOX Index - 6.8.14.png
Semiconductor Index - This is only an opinion. This is not investment advice.
4
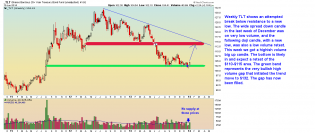
Weekly TLT.png
Weekly TLT - This is opinion, not investment advice.
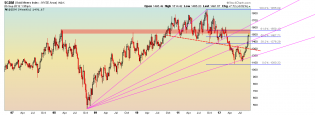
Gold Miners.png
Personally, I feel Tim was too early in calling his analog a bust. I think the miners top in the highlighted red b...
3