Browse Symbol Stacks: $NDX
slopechart_$NDX.jpg
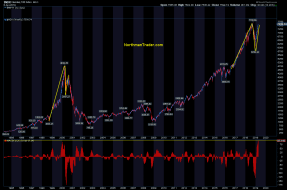
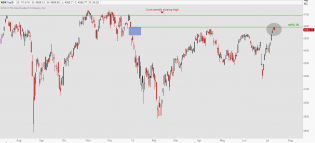
$NDX - Upsy-Daisy

slopechart_$NDX.jpg
$NDX ...making up its mind.
1
slopechart_$NDX.jpg
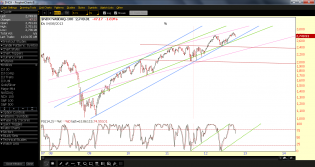
$NDX monthly.
Enthralled with the chart - the candles and where the lines hit.
slopechart_$NDX.jpg
Glorious topping on $NDX.
Now working on the second h.
dgd.png
Top 10 market capitalization:
Looking more and more like distribution and a topping process to me
And 16T is s...

Capture d'écran 2024-01-30 191558.png
Capture d'écran 2024-01-30 180934.png
This is our market today! ALL a volatility trade.
As structured products supply so much vol it pins the index an...
Capture d'écran 2024-01-22 033551.png
Some food for bears
RGEG (1).png
American now and then
5JUN20.png
Now THAT'S some optimism right there!
2
4JUN20.png
Very interesting times to say the least
2
3JUN20.png
Beware of what this market is telling you right now!
4
1JUN20.png
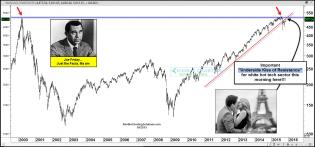
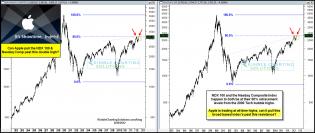
French luxury stocks acting as a leading indicator for big tech?
3JUN18.jpg
2JUN18.png
Both can't be right, can't see how it would be possible!
2
unnamed (9)_211.png (1280×837)
Correlation Between NASDAQ And Bitcoin Since February 1, 2022

3
slopechart_$NDX.jpg
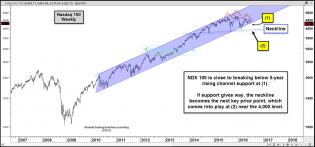
NASDAQ 100
Have a scary chart. If you are a bear, this sell off didn't even get started yet.
If you are a bu...

slopechart_$NDX.jpg
Nasdaq 100 Fib levels from March 2020 bottom with Hunter insanity square

slopechart_$NDX.jpg
Eyeballing an analog. Looks like the exponential blow off top is yet to come. Ouch
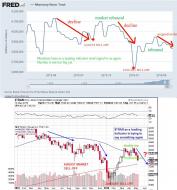
bfm7F10.jpg (1280×663)
Nasdaq is just 5% from record highs and Consensus 12m Fwd EPS is down 11%...
5
slopechart_$NDX.jpg
Another gap rejection. Bulls will be looking to break through next week.

slopechart_$NDX.jpg
Nasdaq 100 still struggling with the Devil's Pitchfork

1
slopechart_$NDX.jpg
Nasdaq 100 rejected at the middle of the Pitchfork
1 feb21.PNG
5 feb14.PNG
4 feb14.PNG
2 feb14.PNG
1 feb13.PNG
1 jan16.PNG
3
1 nov19.PNG
3
slopechart_$NDX.jpg
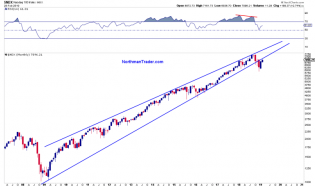
$NDX following simple chart work

NDXW-1.png (1240×819)
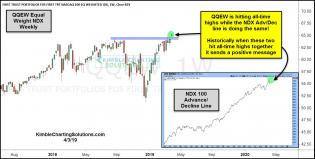
qqew-hitting-all-time-highs-along-with-the-ad-line-april-3.jpg (...
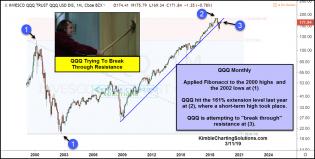
qqq-attempting-to-break-through-resistance-march-11.jpg (1265×639)
1
NDXM.png (768×456)
NDX and RSI

qqq-potential-topping-pattern-feb-5.jpg (1266×643)
3
1 dec4.PNG
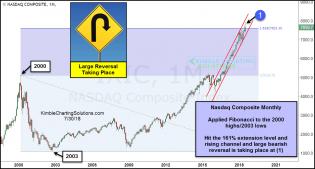
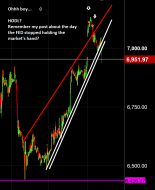
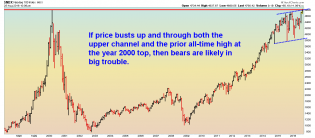
nasdaq-comp-creating-large-bearish-reversal-at-161-fib-level-july-3...
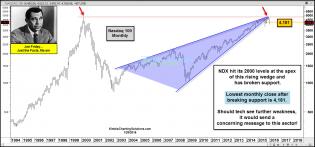
Nasdaq creating large bearish reversal related to 2000 highs!
1
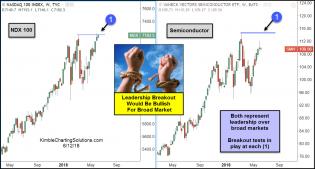
ndx-smh-breakout-attempts-june-12.jpg (1239×665)
1
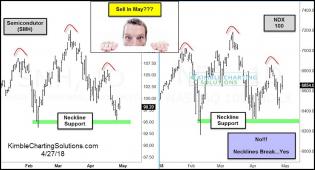
semiconductor-ndx-sell-in-may-topping-patterns-may-30.jpg (866×468)
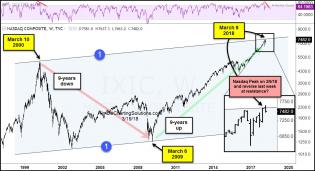
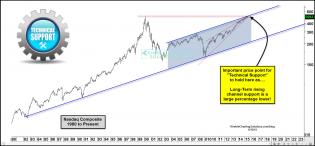
nasdaq-composite-testing-top-of-20-year-rising-channel-march-19....
Is The Nasdaq Market Ride Over? Watch Those Divergences!
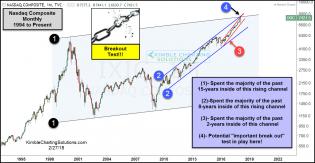
nasdaq-composite-attempting-triple-breakout-at-top-of-three-rising-...
Tech- Most important breakout attempt since 2000?
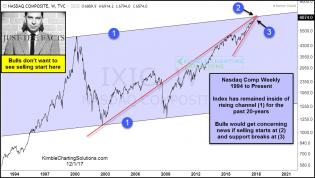
joe-friday-nasdaq-comp-doesnt-want-to-see-selling-start-here-dec...
Tech bulls biting nails at this price point
NDX - Monthly - 8.25.16.png
NDX - monthly chart. This is not investment advice.

2
NDX.png
Extremely close to closing the gap followed by a bearish engulfing day. I'm sure it's nothing.

1
20160709_SPX_DJIA_IWM_NDX.png
Bears still have a chance

1
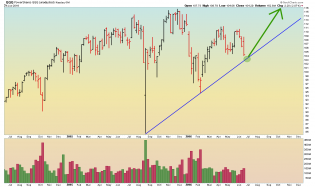
nasd-testing-6-year-rising-support-june-27.jpg (1573×736)
NASDAQ big ass top
2
QQQ - Daily - 6.27.16.png
QQQ daily. This is not investment advice.
3
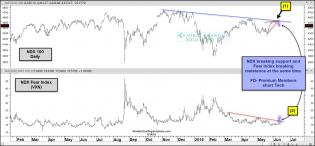
ndx-and-ndx-fear-index-breaking-support-resistance-june-13-1.jpg...
Fear comes into NASDAQ land.
1
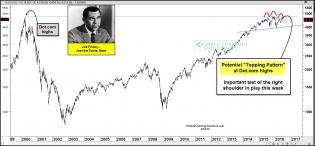
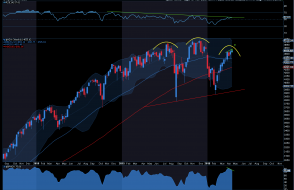
joefriday-ndx-at-right-shoulder-june-10.jpg (1574×731)
Topping pattern on the NASDAQ
1
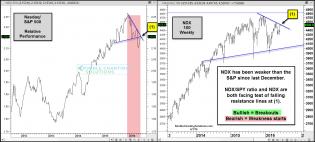
ndx-spy-ratio-and-ndx-testing-falling-resistance-june-2.jpg (1568×709)
Resistance is futile
1
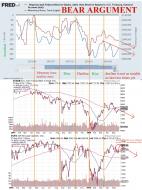
TRAN_SP500_MonetaryBase_Treasury.jpg
Recently I said that Monetary base is acting as leading indicator for Stock Market Indexes. Now I found that there...
2
MonetaryBase_TRAN.jpg
Carnage is coming back this summer.
1
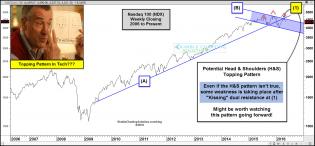
nasdaq-100-head-and-shoulders-watching-close-april-30-1.jpg (1571×733)
As the NASDAQ tops out, preparing to fall into a hellish oblivion, delighting Tim Knight and his readers
2
ndx21.png (2474×1594)
NASDAQ 100 pooping out
5
NDX Weekly - 2.10.16.png
NDX Weekly.
2
joefriday-ndx-testing-monthly-support-jan-29.jpg (1571×736)
NASDAQ and its monster wedge
1
joefridandxyimportantkissofresistanceoct23.jpg (1573×735)
NASDAQ hits underbelly of broken trendline.
3
ndxnastsladoubletopsaug14.jpg (1566×708)
Gargantuan long-term double-tops in play
2
nasdaqcompositetechnicalsupportneedstoholdjune12.jpg (1571×733)
Mega-wedge for the NASDAQ
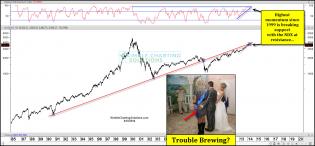
ndxtroublebrewinghimobreakingsupportapr10.jpg (1571×732)
Mo Mo stocks have been in the news, now some are calling them No-mentum stocks. Speaking of momentum, levels have...
2
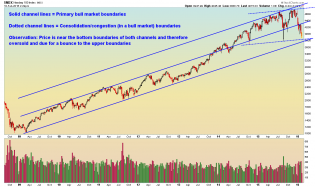
sc.png
I posted this chart several weeks ago .. so here is an $NDX Chart Update .. 30 years of resistance IS BEING consisten...

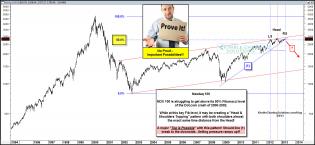
ndxperfecttoppatternapr4.jpg (1575×728)
Near “Perfect Head & Shoulders” topping pattern in place in the NDX 100? Large decline possible!!!
ndxgoogleoct18.gif (1560×692)
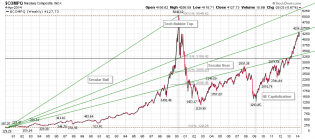
2012-10-09_NDX100.png (1366×728)

ndxstopinthenameoffiboct9.gif (1577×730)
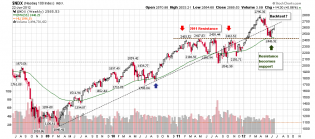
ndxnascompat50percentfiblevelsaug28.jpg (1561×663)
The NDX and COMPQ are both at their 50% retracement levels - an amazing chart!
$NDX

1