Date: February 28, 2013

JY 30 MIN.png
$JY_F: Bullish setup = Globel Risk Off


ES 15 MIN.png
$ES_F (GLOBEX): We have a potential impulsive decline Bears have a potemtial reversal setup

0228-fibs.png
Anyone who wants to buy this market is freakin' INSANE.
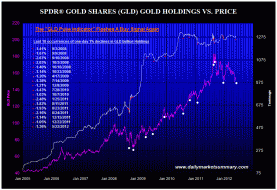
GLDPuke52212.gif (911×623)

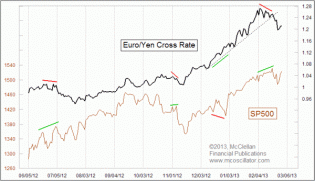
Chart In Focus
EUR/JPY vs SPX negative divergence signalling trouble ahead for the markets.


content.screencast.com/use.../VIX22813.gif
VIX Daily Chart
This ain't over. Just getting started. Positive MACD divergence. More VIX upside will first b...

spx 5 min.png
$SPX: The bearish count

VIX DAILY.png
$VIX: eod Doji it could mean a bottoming attempt

spx 5 min.png
$SPX: Possible count

TLT DAILY.png
$TLT: Not suggesting a sustainable equity rally

DOW 5 MIN.png
$DOW: Instead of a DT price could be forming a Triangle

DOW 5 MIN.png
$DOW: Possible DT for a wave (4) pullback
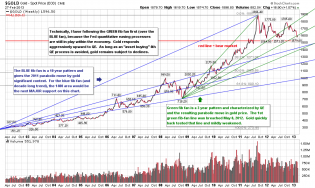
gold big picture.png

2

indu
Dow Reverse Symmetrical Triangle, going to kill bears or bulls?

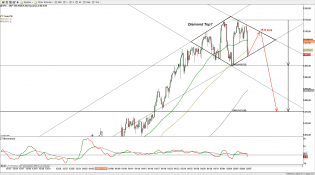
20130207-SPX-4.png (1920×1072)

2

YG 30 MIN.png
$YG_F: The short term trend of Gold should give clues on the sustainability of more equity upside

USD JPY DAILY.png
$USDJPY: Another Triangle. This one should have established a Top

JY DAILY.png
$JY_F : The EWP is suggesting that a bottom is in place
SPX: FOLLOW UP OF THE SHORT TERM EWP
SPX: Follow Up of the Short Term EWP | The wave trading
SPX: FOLLOW UP OF THE SHORT TERM EWP