Date: March 13, 2014
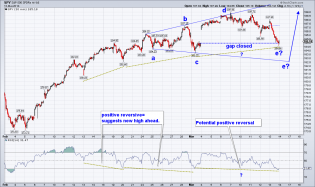
spy 30 min 3.13.14.png
Today with the down action in the major indices all of my short term indicators of trend for the indices went nega...

sc.png
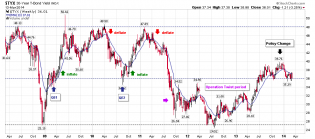
30 yr yield back near CRITI...

1

20140313_EUEOD1.png (890×498)
Europe is totally disconnected from US stocks (for now)...
1

foodpricesmoovinghigherthisyearmar13.jpg (1572×710)
Food prices Moooooving Higher this year! Of course, that pig Yellen doesn't think there's any inflation.
1

5yearlowtohighhappyannivmar121.jpg (1571×733)
Happy Anniversary Top at hand? 5-year rally the “Exact” same length?

dshort Featured Charts
My Unique Dow Chart w/ Commodities and My I. P. Counts
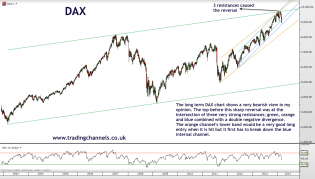
Trading channels: Bears waking up
What are ze Germanz doing?


dshort Featured Charts
The flat-line chart shows that job growth has paced population growth and little else.

dshort Featured Charts
The Fed sucks whale: The poll also showed this is still the single worst economic recovery ever.
1

Stock Margin Debt Reaches Record-High, Surpassing 2007 Pre-Crash Level
Stock Margin Debt Reaches Record-High,
Surpassing 2007 Pre-Crash Level
1

Russian troops_0.jpg (598×391)
Russian forces on the Ukraine border

20140313_oops1.png (964×501)
S&P 500 Turns Red For 2014 (Retraced All Post-Putin Gains)
2

VIX DAILY.png
$VIX: Potential Double Bottom target = 19.95

VIX DAILY.png
$VIX: Potential Double Bottom target = 19.95

SPX 15 MIN.png
$SPX: A short term bottom should be in place but the pattern is far from being completed

content.screencast.com/use.../SPX31314.jpg
$SPX hourly chart
Good day today. After breaking out of the rising wedge structure earlier this week, SPX saw...


SPX 5 MIN.png
$SPX: The wave 1 of a larger impulsive sequence could be in place

SPX 15 MIN.png
$SPX: Follow up of the DZZ count
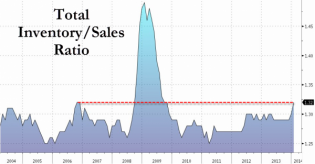
Auto-Industry Over-Production Sends US Inventory-To-Sales To Pos...


Auto-Industry Over-Production Sends US Inventory-To-Sales To Pos...

sgr
Best upside in precious metals is not likely to get going until silver gets going... in relation to gold.

1

gold.spx
So far gold continues to grind upward vs. the stock market. This is a non confirmation for the market at least fr...
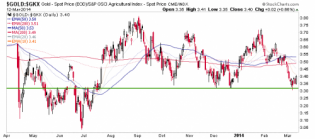
gold.gkx
Gold vs. Agri has probably bottomed. Expect it to hold support as monetary relic over the long term holds value v...
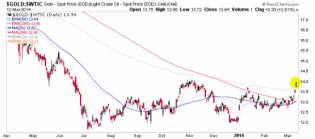
gold.wtic
Gold vs. Oil breaks upward, a positive fundamental move for gold mining.

SPX 5 MIN.png
Lets see if the corrective bounce is confirmed

QQQ DAILY.png
$QQQ: The bearish wedge will withstand ?
2

UUP DAILY.png
$UUP: Potential "Bullish" wedge

Stewart 17 equations table

Mathematics is all around us, and it has shaped our understanding of the world in countless ways.In 2013, mathematician and science author Ian Stewart published a book on 17 Equations That Changed The World. We recently came across th...
The 17 Equations That Changed The Course Of History | Business Insider