Date: March 27, 2014
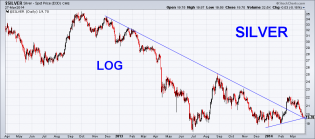
Silver daily log.png
Daily silver: Two potential support lines. I would not be surprised to see a upside reversal here. TGIF Have a...


EUR 120 MIN.png
$EURUSD: Wedging = Leading Diagonal A or (I) ?

SPY
SPY

1
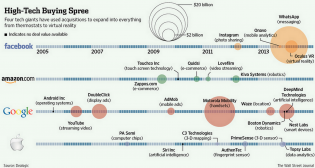
20140327_hitech.png (2020×1082)
The Dot-Com 2.0 Tech Buying Spree (In 1 Simple Chart)

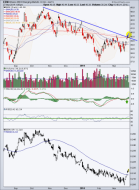
RBC.png
RBC: Nice Head Shoulders for a small 10% target price drop.


LTC.png
LTC: Symmetrical Triangle. Wait for price to confirm the break of the pattern to the up side or the down side. It'...

kirk.png
KIRK: Nice big Head Shoulders. Big target on this guy.

SXI.png
SXI: Head Shoulders Top about to confirm the neck line break. Interesting it has a double header. Compounded head...

SPX 5 MIN.png
$SPX: Chopping .... Maybe with the intention of a countertrend bounce
eem.spy
EEM trying for 2nd day above MA 200. EEM vs. SPY up hard. This despite stronger USD and few inflation concerns.


SPX 5 MIN.png
$SPX: The wave C option requires a failure at 1863 or lowe

ndx
NDX... bounce or not? Very similar setup to early Feb.
3

SPX 5 MIN.png
$SPX: Probably the impulsive decline off yesterday´s hod is not done yet now wave iv
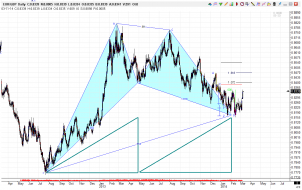
EURGBP_Daily_10March14.png
Could this be the low for EURGBP. Price and time meet. Is the pattern complete?

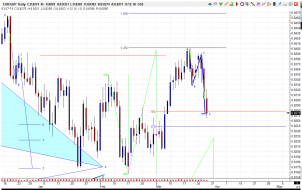
EURGBP_DAILY_27MARCH14.png
EURGBP at the 61.8% Retracement and AB = CD pattern.

tlt.spy
TLT-SPY looking bullish again, which means RISK is looking bullish again, which means that the stock market is not...

CL 60 MIN.png
$CL_F : Hoping it is forming a wedge