View: Inflection Point Test | Slope of Hope#more-20153
Inflection Point Test | Slope of Hope#more-20153
SHJack
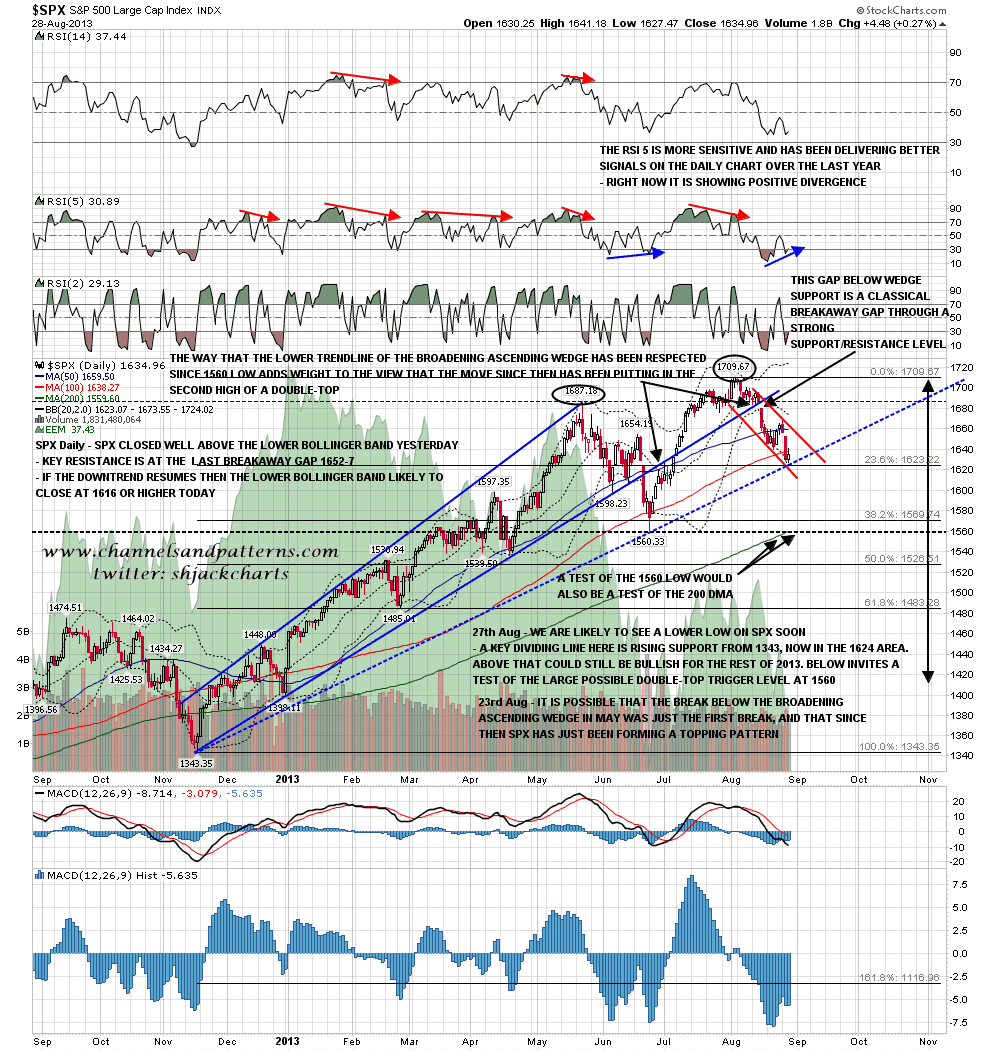
A key target I have been watching on this retracement has been rising support on SPX from 1343. That was tested yesterday, or very close at least, along with the 23.6% fib retracement of the move up since 1343. On my more bullish scenarios for the next year that is a key level below which they are eliminated, and a test of the 1560 low and the 200 DMA (currently at 1559) becomes likely. We have therefore made a possible retracement low, and if the last breakaway gap at 1652-7 should be filled then that would become a probable retracement low in my view. Until that happens however the bears still own this tape and what we are looking at from yesterday’s low is an oversold bounce. SPX daily chart:
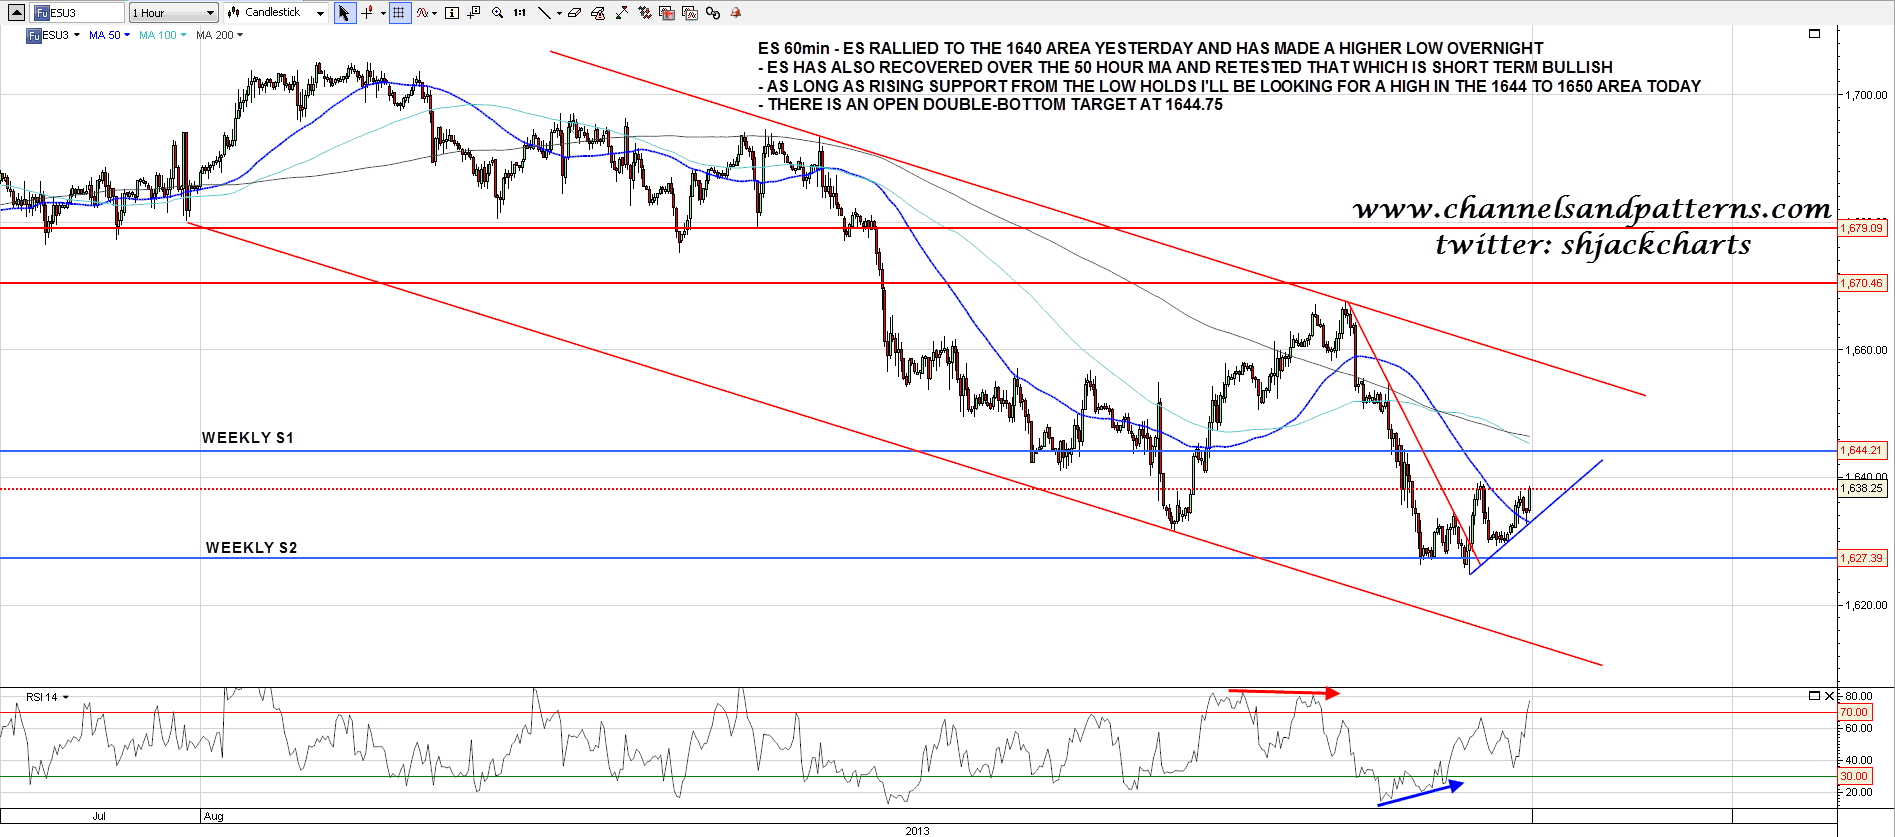
Will that oversold bounce go higher? There is a very clear dividing line this morning as there is a three touch rising support trendline on ES from yesterday’s low hat’s now at 1633.5 and the 50 hour MA is at 1633. That 50 hour MA was recovered and retested overnight so as long as rising support holds I’m leaning bullish today with an upside target in the 1644-50 area. If rising support breaks then I’m watching support levels in the 1623 and 1614 (declining channel support) areas. ES 60min chart:
I was scanning through various indices this morning and was struck by the setup on the COMPQ (broad Nasdaq) chart which perfectly fits the options that I’ve been looking at above. COMPQ has formed a 70% bullish broadening descending wedge from the high and wedge support was hit at the low yesterday. On the bull scenario COMPQ now returns to wedge resistance and breaks up. On the bear scenario COMPQ is forming the right shoulder on an H&S which has an ideal high in the 3625 area and should take another day or two to form. COMPQ 60min chart:

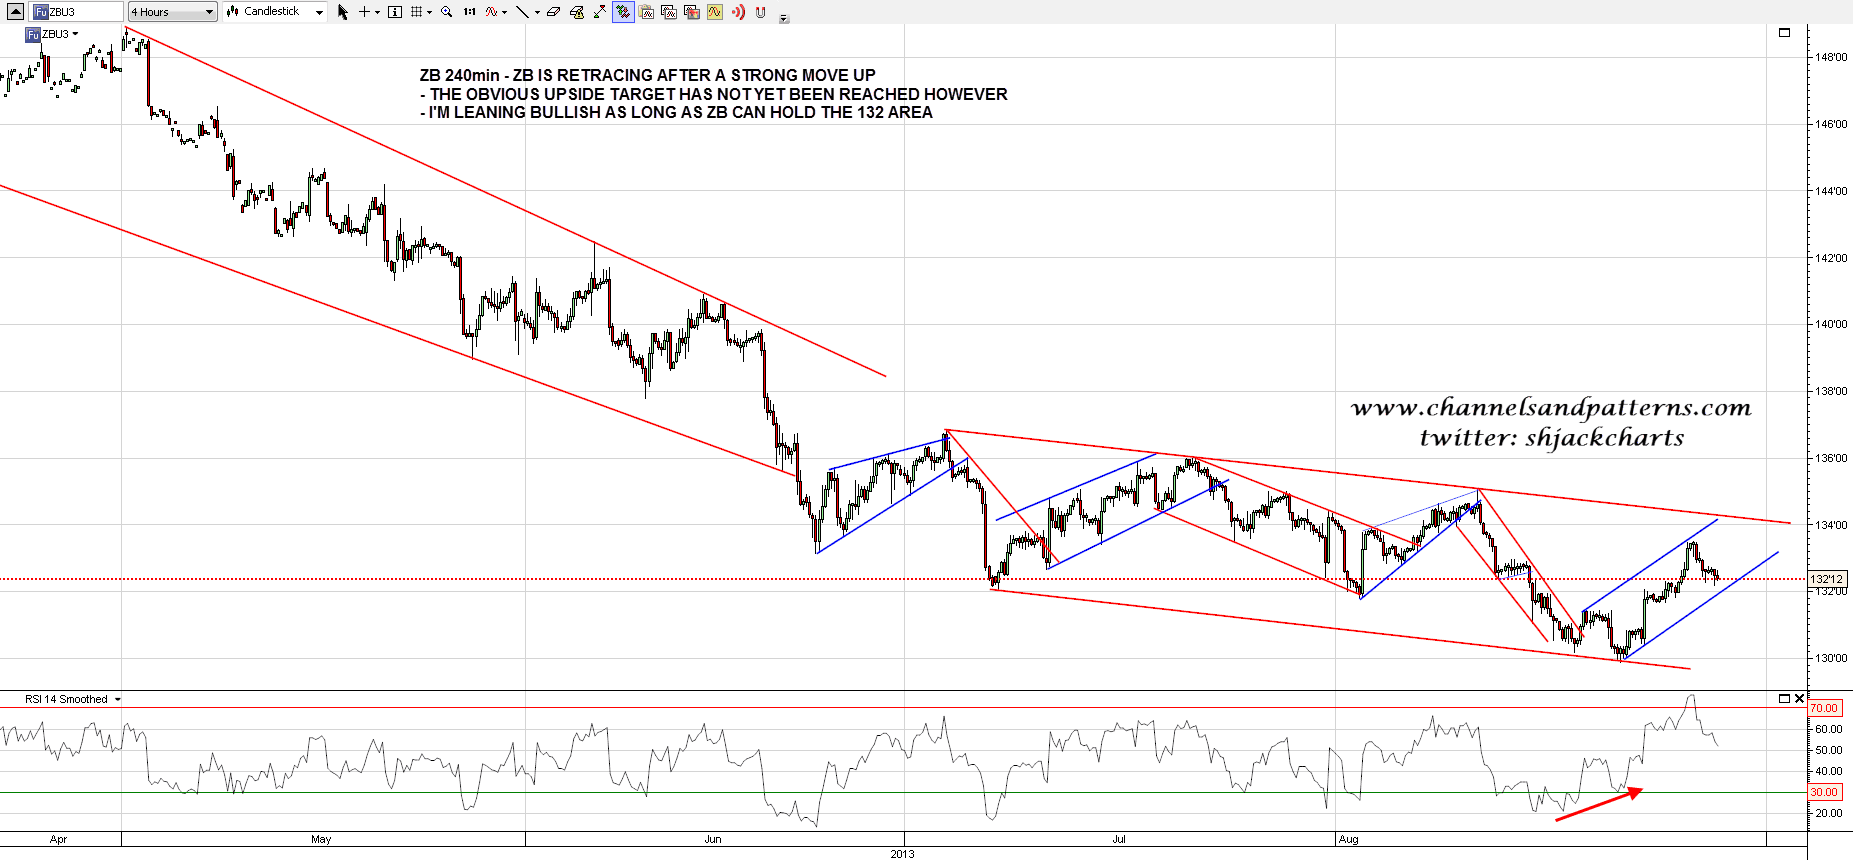
On other markets CL is treading water waiting for more news about Syria. I’m leaning bullish but won’t show the chart today. ZB is retracing after making the double-bottom target and getting very overbought short term. My main upside target over 134 hasn’t been hit and I’m leaning bullish as long as ZB can hold support in the 132 area. ZB 4hr chart:
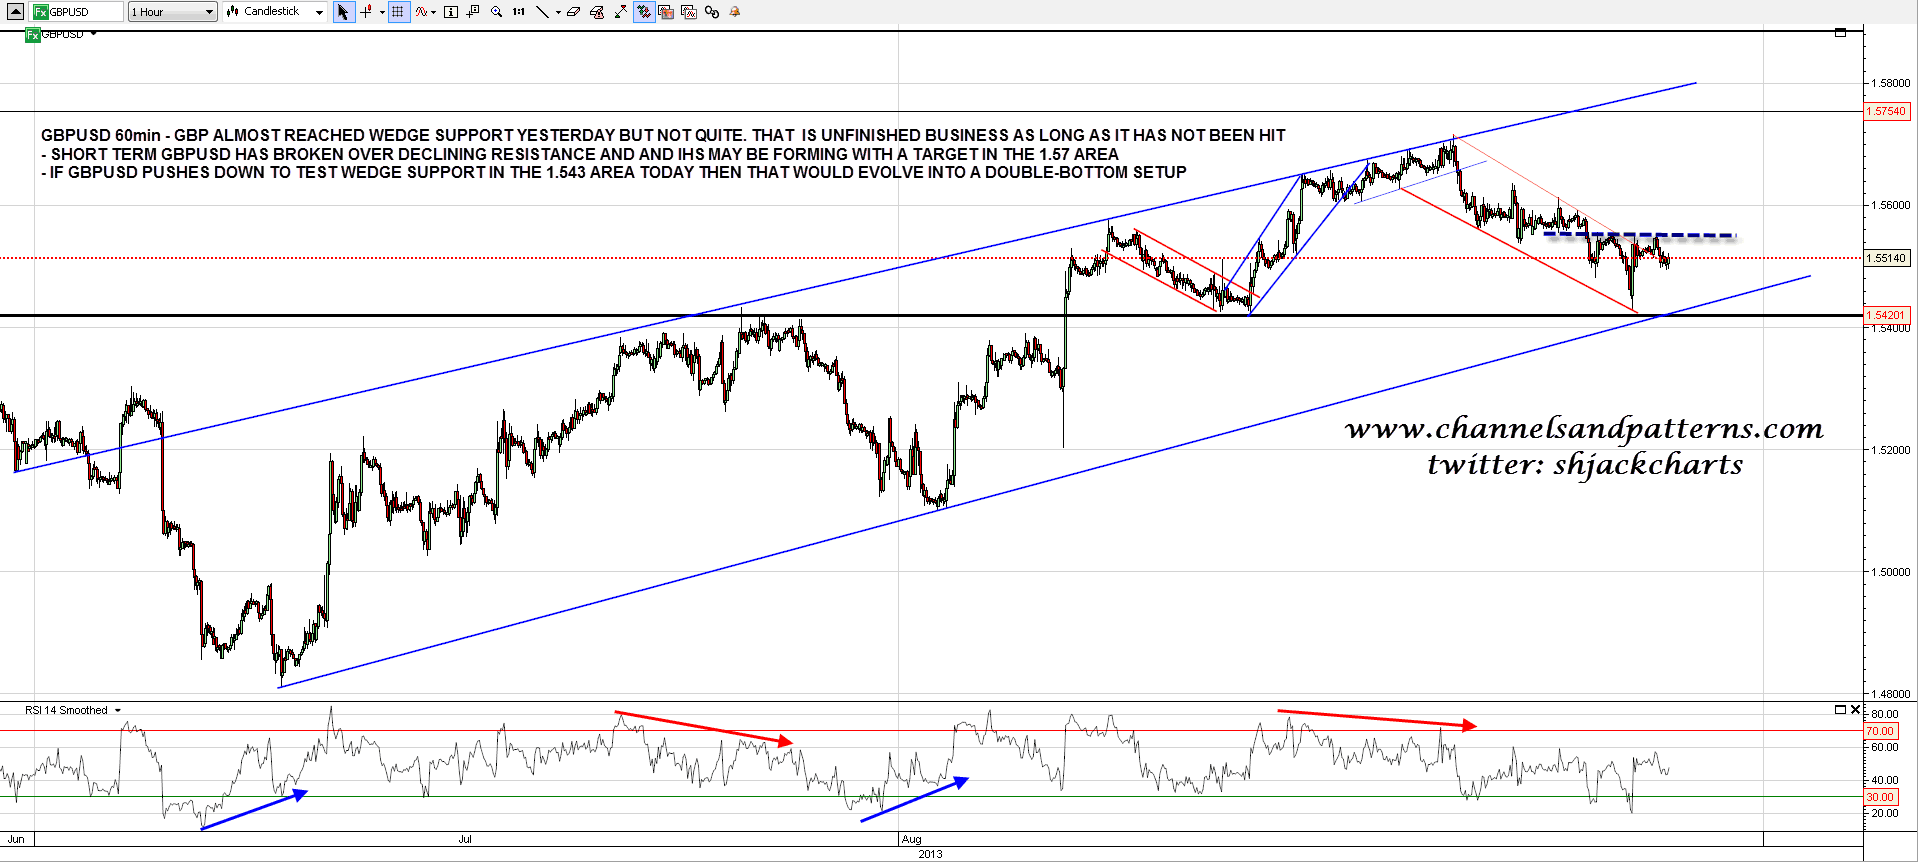
GBPUSD just missed rising wedge support at the low yesterday and that is unfinished business to the downside until that is hit. Short term though GBPUSD has broken declining resistance from the high and may be forming an IHS targeting the 1.57 area. If we see a retest of the low then wedge support is now in that 1.543 area and that would be a possible double-bottom that would target the 1.57 area as long as wedge support holds. GBPUSD 60min chart:
As I’m writing ES is retracing to test rising support on ES at 1633.50. Whether that support holds or breaks will most likely determine whether we retest the lows or rally into the 1640s today.
Comments
No comments yet.

