View: ES Quantitative Analysis | Slope of Hope
ES Quantitative Analysis | Slope of Hope
All right, let’s pick up the wreckage from yesterday’s trading day and let’s try to make a bit of order.
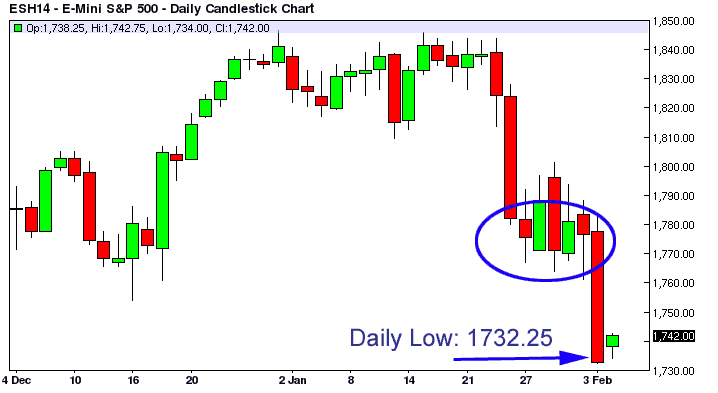
As you know yesterday we theorized that the market was bottoming in the blue-circled area in the chart below, the odds were good, however the market went lower. From a probabilistic point of view the odds just got better for a LONG trade, both DAILY and WEEKLY. The more the market stretches to extreme limits, the higher the chances of a sudden sling back.
Each time we enter a trade there is always a risk the trade does not work, we don’t pretend to be RIGHT or WRONG, we just want to assess the odds (probability of success) for a trade, so that we know our RISK – then we enter the trade, with a Stop Loss, and if the trade does not work we will be stopped out possibly with a small loss.
For those of you that have already subscribed to our products, today we should be able to release to you a FREE downloadable 2-hours video documentary/course that will train you from A to Z in the use of our tools and will explain you in fine details our trading philosophy.
Back to market analysis, yesterday we saw an interesting reading on the Hourly+Daily ES LONG calculator around the time the market bottomed:

Basically the price area around 1738.50-1743.50 (Hourly-Daily) was showing a total combined of 90.73% odds (100% the Hourly + 81.45% the Daily, divided by 2). The ES was down for 5 hours in a row.
Usually these are VERY extreme odds, so going LONG was recommended.
Futures then went lower than 1738.50, however the Stop Loss must be set at 1/3 of the distance between the level you entry and the next level, so if you entered at 1738.50, your Stop Loss should be set at 1730. So far this Stop has been holding overnight – at the moment of writing the ES is around 1742.
We still don’t know if today the ES will close up, the odds are in favor of that, however after a nose dive like the one we have seen yesterday it is highly possible to see a bounce at the open and then a new collapse to lower prices.
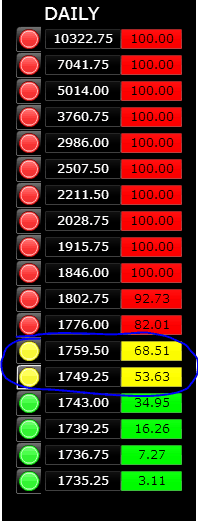
Here below we have highlighted the next valid price levels to go LONG:1720-1716-1718. Please note this screenshot below is always the same set of levels/odds to go LONG that we have been analyzing in the last few days. Price and odds sit there and do not change until the market reverses its trend and satisfies the setup (i.e. a close up in this case). This gives you a stable setup that does not modify itself at each market wiggle like most indicators do. MACD anyone?

If these levels indicated with the yellow arrows above are reached, the market will be ultra-overbought and a bounce will be almost 100% sure (barring a sudden market catastrophe that at the moment does not seem to be on the horizon). Please note also the Monthly at 1718 level has 53.33% odds, these are quite good odds for a Monthly time period, they support the LONG setup very strongly.
For die-hard shorters, should the market bounce up today, if you want to go SHORT again, here below are the levels where the market will most likely end its rebound: 1749-1759, odds between 53 and 68%, quite good. 1743 is too early in our view, plus the market almost got there overnight, so this level for sure will be trashed if the market bounces at the Open.
These SHORT levels are also the LONG profit-taking targets for those of you that went LONG yesterday.
If you want to sign up to our the online quantitative tools shown in this post, please follow this link and subscribe to the special “SOH Offers”.
Copyright © 2014 Retracement Levels. All Rights Reserved
Comments
No comments yet.

