View: ES Quantitative Analysis | Slope of Hope
ES Quantitative Analysis | Slope of Hope
Before beginning our ES Quantitative Analysis for today, let us address the issue of the coupon code kindly mentioned by Tim in this post.
The coupon code was valid for a set number of users, when that number was reached the coupon stopped working.
However, you can still sign up using the following workaround: click on this link, you will land on RL’s sign up page. Select the product called “SOH Offers”. This is a temporary special offer created exclusively for SOH readers. You will get exactly the same product and price described by Tim in his post, but no coupon code is required.
Once a certain number of subscribers are reached, the offer will be withdrawn, so hurry up!
Thank you for your enthusiasm about our product, we really did not expect so many of you to be interested in our research.
Now, the good news is that we will continue to post a brief ES Quantitative Analysis, once or twice a week, focusing on high probability setups.
Here below you can see the TIME STRETCH perspective for today, for ES. Please note our “SOH Offer” includes also access to the NQ, DJI, DIA, SPX, SPY, SDS, SSO tickers, and the ES and NQ are also available in the Hourly+Daily format which is specifically geared up for day traders (the Hourly will change setup every single hour).

What can we say about the above? Very simple, the WEEKLY time period is very oversold, you can see 90.60% odds to see a LONG reversal this coming week. A LONG WEEKLY reversal means a week closing higher than the previous week. So, in short, the WEEKLY time period is saying it is time to BUY.
Now let’s see if the PRICE STRETCH analysis below confirms that. First let’s have a look at the WEEKLY prices and odds.
The ESH14 low, last week, was printed on Thursday: 1761.25. You can see our 1763 price level (WEEKLY column, yellow arrow) has 90.32% odds. These WEEKLY prices/odds were published after the Close on Friday 24th of January, so they have been sitting there for the entire last week, they have not changed and has provided us with a key information: the market is short-term bottoming.
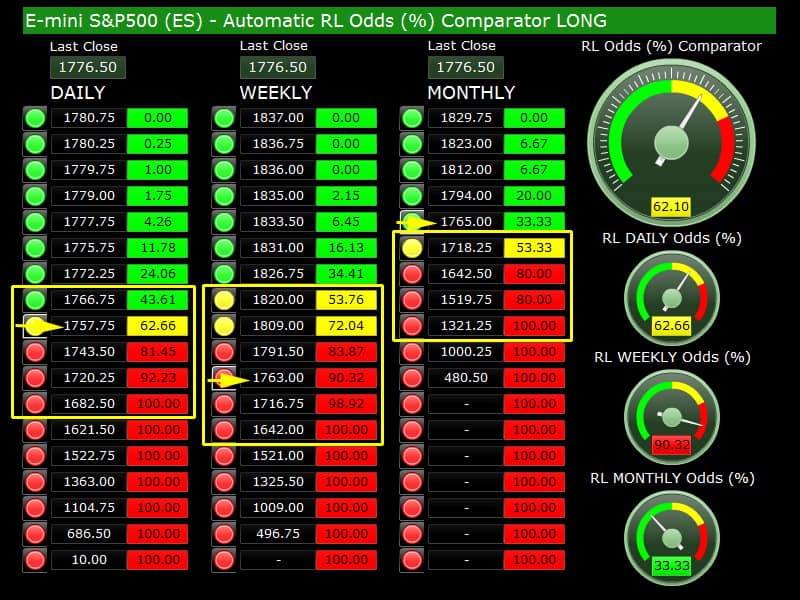
If you have a look to the ESH14 chart below, you can see that in fact, last week the market bounced several time from the area found between 1770 and 1760. So, it appears that we are reaching the point where the market will form a bottom and bounce and more precisely it will likely bounce and close up this coming week. As a final note we will add 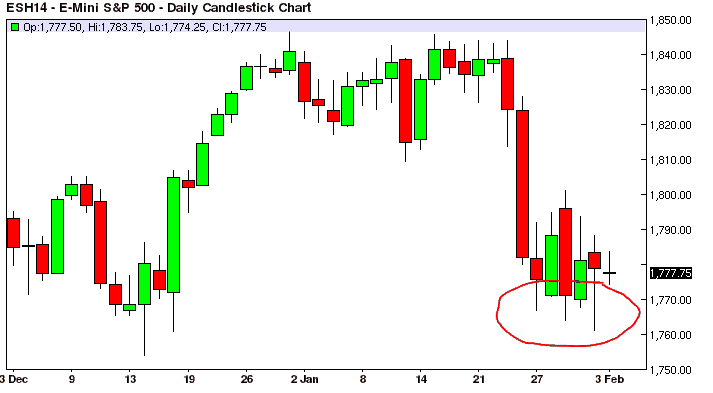 that the DAILY and MONTHLY price/odds around the 1757-1765 price area are quite good right now and supporting the WEEKLY trade setup. Check out the yellow arrows in the image above (above the chart).
If the market does not bounce this week, if this week closes down again, the odds for a LONG bounce will increase even more for the following week.
Basically from here we are in a “red zone” where the market is like a rubber band that has been stretched near to its (WEEKLY) limit and it’s about to sling back.
If the bounce is strong and no correction follows, great gains could be made buying from here – if the market returns to the previous highs.
Basically what the market may have offered here is a chance to buy at better prices.
The other, alternative scenario, is that we will have just a one week bounce and after that the market will go lower. In any case, at this stage the market odds to go LONG are too good for a SHORT trade, on average. If you want to go SHORT, it is better to wait for the bounce and fade it.
Comments
No comments yet.

