View: ES Quantitative Analysis | Slope of Hope
ES Quantitative Analysis | Slope of Hope
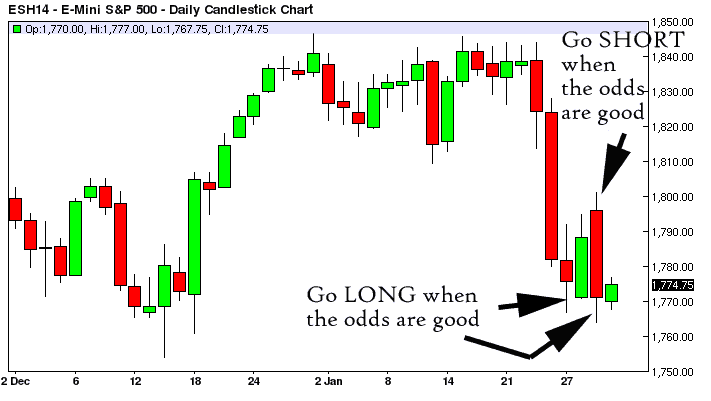
In the last few days you should have seen quite well how to use the Odds Comparators in action. Here is a brief re-cap: when the odds for a LONG trade become good (see image below, black arrows pointing at the end of red candles), we enter LONG trades. Then on the following bounce, we let the market exhaust its push and when the odds are good we go SHORT again.
If the odds are not good we do nothing, we wait for good odds.
Not all trades are good trades, some are just risky gambles, in that case we wait for a better occasion.
If you read the Dao of Capital by Mark Spitznagel, you will find some similarities between our method and the roundabout investment approach he describes. We differ on many aspects (for example in the investment vision and his application), but we have in common the attitude of building a strategic position for when the right moment to strike arrives. This process takes patience, and finds us often (if not always) on the “wrong” side of the market, until suddenly the trend reverses its course and at that point we are instantly profitable.
Let us also re-cap what happened in the last few trading days and how RL was useful:
- the market tanked, reached good odds to go LONG (above 90%)
- the market bounced and the odds became good to go SHORT. The price levels/odds to go SHORT (below) were published on Tuesday 28th, before the open. If you go back read our post on that day you can see we recommended the 1797-1801 price area because the odds for a SHORT reversal (i.e. correction) where good. The ESH14 yesterday peaked at 1801.25, which is 1 tick above our Weekly SHORT level (1801.00, 46.15% odds) and then tanked again, so we can say that somehow we nailed the top.

TO GO LONG ANALYSIS
PRICE STRETCH PERSPECTIVE (price distance from the Last Close):
the LONG Odds (%) Comparator below show us the price ranges (squared in yellow) where you have the highest probability of seeing a LONG trend reversal .
The gauges indicate what are the odds at the price levels indicated by the yellow arrows.
When you have a good probability (>50%) on ALL the time periods, the LONG setup gains stronger validity.
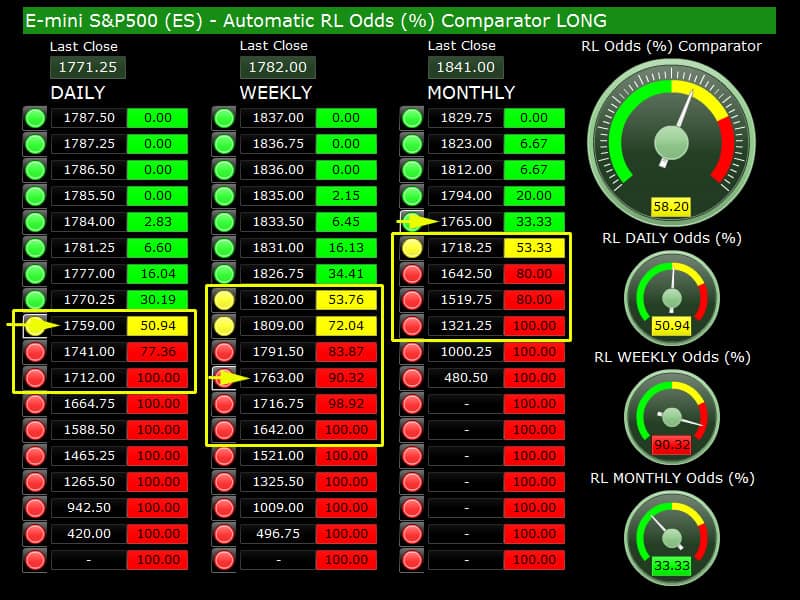
LONG Market Analysis/Comments:
Yesterday the market went down again and reached price areas slightly above the ones indicated by the arrow in the image above. These price areas are valid support for today, the odds are good enough to try on the DAILY (50.94%) while they are excellent on the WEEKLY.
What does this means? It means that the WEEKLY at 1763 is VERY oversold and although it could go lower and reach 1716, the odds are already massively tilted in favor of a bounce. Please remember the entire investment game is basically a gambling game, so we want to know what is the probability that the market will turn in our favor when we place a bet.
It has to be said that our tools are accessible 24/7 while this written analysis comes right before the US Open, so it may be late to take action if a level was reached overnight. This is not an issue for those that have 24/7 access because they will program their trades the night before. Often you wake up in the morning, a level has been reached overnight and the market bounced up and you are already profitable at breakfast time.
TO GO SHORT ANALYSIS
PRICE STRETCH PERSPECTIVE (price distance from the Last Close):
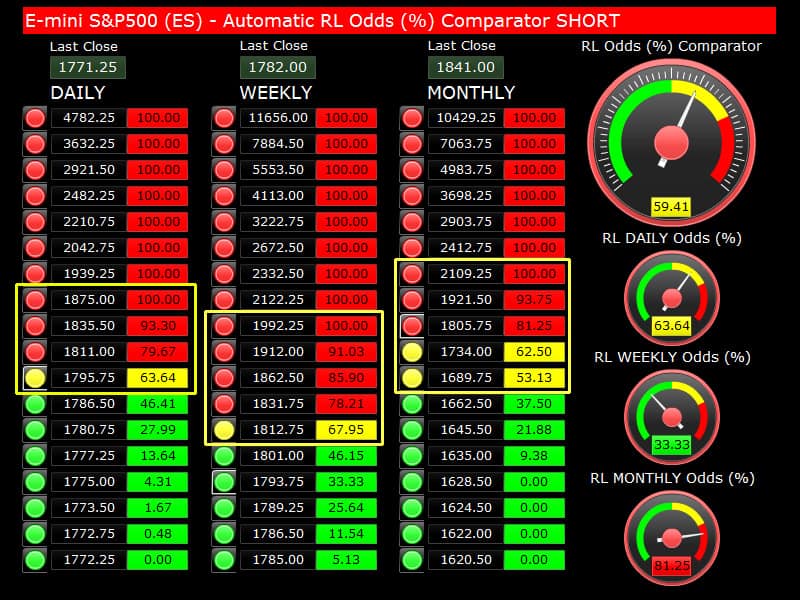
the SHORT Odds (%) Comparator below show us the price ranges (squared in yellow) where you have the highest probability of seeing a SHORT trend reversal.
The gauges indicate what are the odds at the price levels indicated by the yellow arrows.
When you have a good probability (>50%) on ALL the time periods, the SHORT setup gains stronger validity.
SHORT Market Analysis/Comments:
The first valid to go SHORT is 1795.75 DAILY, with 63.64% odds. We are not indicating with the arrows the prices to go SHORT because we do not feel like recommending any trade SHORT at the moment, the market may try a strong push higher today, so until good odds DAILY and WEEKLY are reached, probably is better to wait. If you want to try 1795.75, go ahead, but be aware the market may go higher than that, so you’ll need a Stop Loss.
The alternative scenario is to see a weak bounce and then a new dive, but in that case we won’t touch any level with good odds either. So let’s say today is one of those days where the GO SHORT party would better wait and see what happens before being wiped away.
If you are already SHORT, try to hold, if the market goes down you will make some gains, but check the odds to go LONG, there is not much room left on the WEEKLY and even the DAILY offers good support at 1759, that is not very far away from where we are now… SHORT gains are capped in the short-term and until we get at least 1 WEEKLY Close up.
Copyright © 2014 Retracement Levels. All Rights Reserved
Comments
No comments yet.

