View: ES Quantitative Analysis | Slope of Hope
ES Quantitative Analysis | Slope of Hope
When we started to post our analysis a few days ago, someone in the forum commented that our Stop Loss was too far away…
In the last 2 days the ES tanked more than 50 points, so now our Stop Loss at 1728.50 does not look that far fetched anymore.
Please consider this: the trading range that we offer, from the first valid trading level to the Stop Loss has been quantitatively assessed using several years of trading history data. This means that we offer a trading range that is valid for all weathers, not just for when the market goes up all the time and dips a few points before going up again.
Thanks to our approach the trading range remains valid even during larger pullbacks/corrections, like the one we are seeing in these days.
So in conclusion our Stop Loss must be considered as the furthest point away that can be reached by an impulse. Knowing this information helps the investor/trader to place strategically his bets in the expected price extension range.
This information is extremely valuable to both Bulls and Bears and in these days it is especially valuable to Bears and now we will show you why.
The chart here below shows the current ESH14 situation, photographed at the moment of writing, before the US market Open. Try to answer the questions posted on the chart, if you can.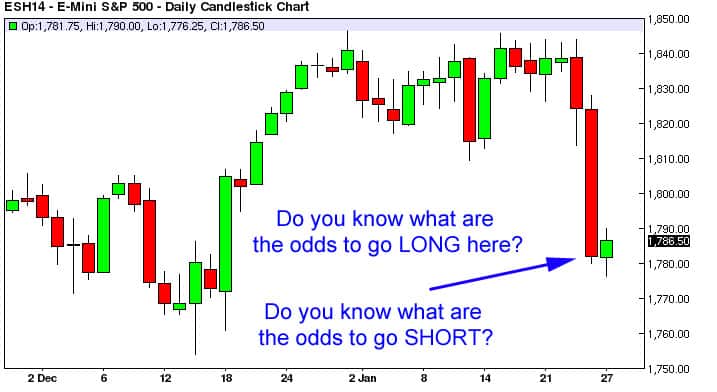
Most Bears, as soon as they see something like the chart above, will start to go SHORT, in the hope of a continuation of what they see, i.e. a correction.
The problem is this: they are late. They should have gone SHORT two days ago, when the odds to go SHORT were good.
For your information, the odds to go SHORT at the moment are ZERO.
The odds to go LONG instead are very good, the market is about to bounce, probably already today (or otherwise the chances will be even higher tomorrow).
So, this shows you one of the (many) reason why our tools are valuable to an investor: they prevent you from entering a trade that is almost completely exhausted (it could go lower but the chances are slim and trading is mostly a probabilistic equation, so you need to consider the odds).
Our tools are telling you to lock in the profits from your SHORT trades right here because a LONG reversal is upcoming and when it comes it will wipe away your profits. Yes, the market may go lower than this, but the risk of a sudden violent reversal should make you wise and bring home what you gained rather than re-gamble it all on the table.
TO GO LONG ANALYSIS
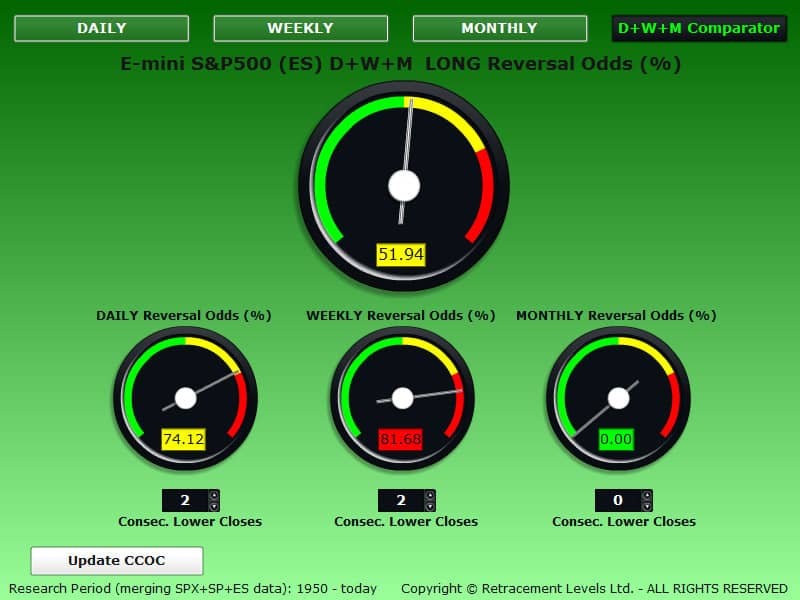
TIME STRETCH PERSPECTIVE (number of consecutive negative closes):
the CCOC DAILY gauge below is showing good odds to GO LONG. The WEEKLY time period supports the DAILY: it has good odds.
PRICE STRETCH PERSPECTIVE (price distance from the Last Close):
the LONG Odds (%) Comparator below show us the price ranges (squared in yellow) where you have the highest probability of seeing a LONG trend reversal .
The gauges indicate what are the odds at the price levels indicated by the yellow arrows.
When you have a good probability (>50%) on ALL the time periods, the LONG setup gains stronger validity.
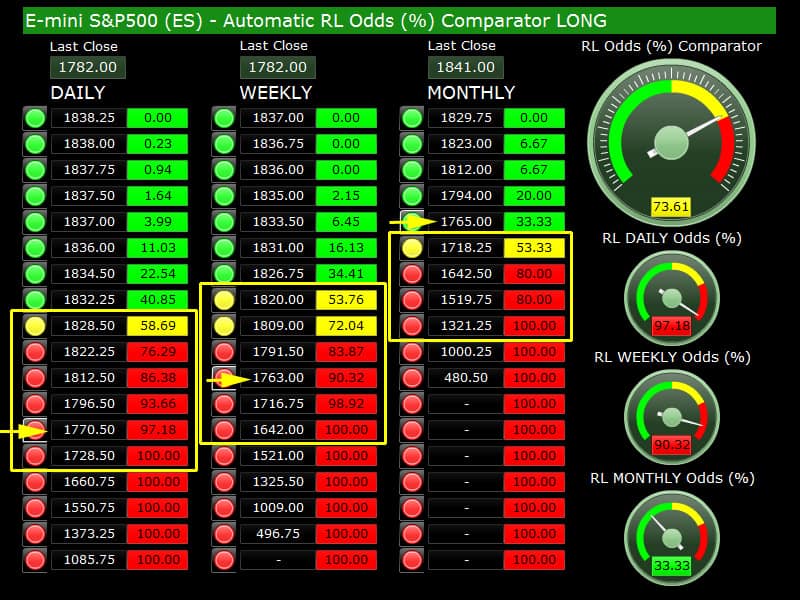
LONG Market Analysis/Comments:
You can see that the market has now reached price areas with excellent DAILY and WEEKLY odds. If today it goes down to the 1770-1763 price area, the odds will be really good.
A LONG reversal is behind the corner, it will probably happen today or tomorrow, with a positive Daily Close.
One day up will be enough to satisfy our setup, in other words the market can go down again after that day up. Our prediction is that the market will bounce soon, for one day, then after that we can only predict the end of the uptrend, we can’t say if it will last 2 or 3 days, although most likely it won’t last more than 3-4 days (in fact it may just last for one day, but again, we cannot predict exactly how many days the bounce will last).
TO GO SHORT ANALYSIS
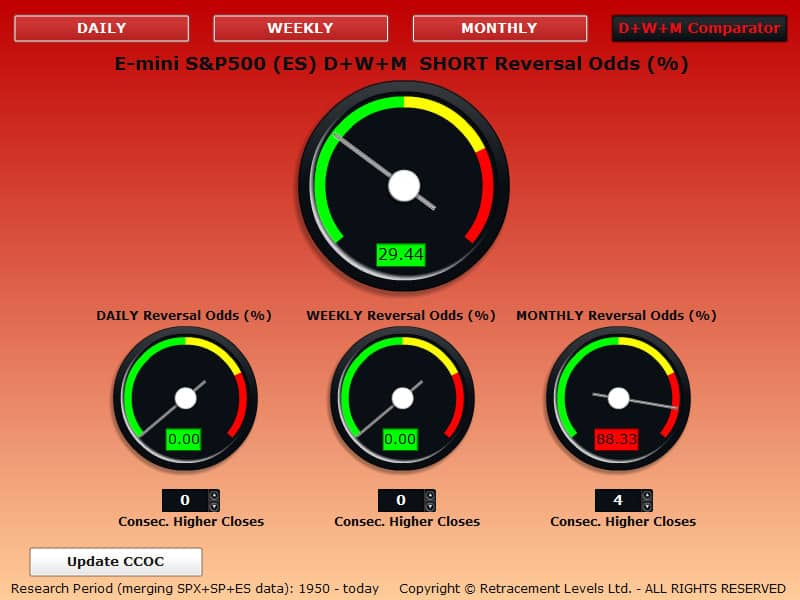
TIME STRETCH PERSPECTIVE (number of consecutive positive closes):
the CCOC DAILY gauge below is showing 0% odds to GO SHORT DAILY and WEEKLY.
The MONTHLY time period is showing >88.33% odds but that was valid when the price closed at 1841 (latest Monthly Close) and remained valid as long as the price was above 1841. Now is no more valid. This gauge will be updated at the next Monthly Close, most likely it will go to zero.
PRICE STRETCH PERSPECTIVE (price distance from the Last Close):
the SHORT Odds (%) Comparator below show us the price ranges (squared in yellow) where you have the highest probability of seeing a SHORT trend reversal.
The gauges indicate what are the odds at the price levels indicated by the yellow arrows.
When you have a good probability (>50%) on ALL the time periods, the SHORT setup gains stronger validity.
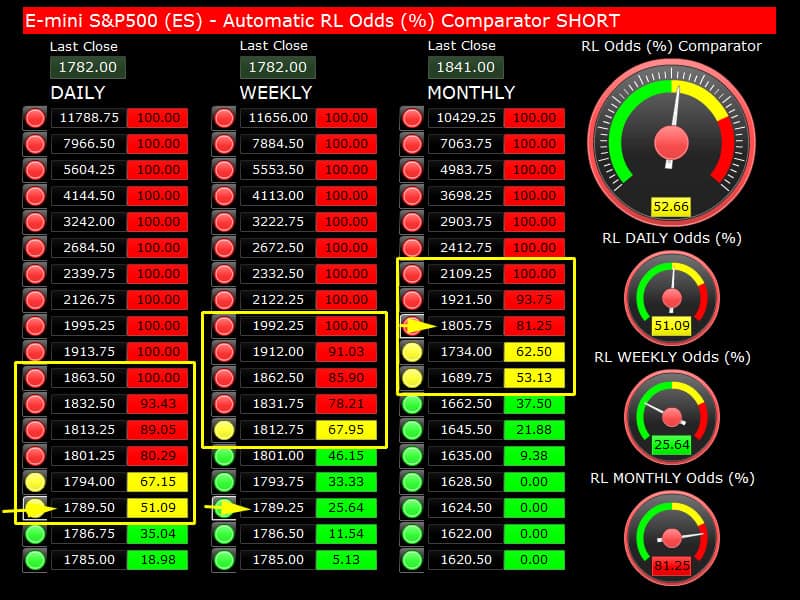
SHORT Market Analysis/Comments:
The first valid to go SHORT is 1789.50 DAILY, with 51.09% odds. This level has been already reached overnight. Going SHORT on this early level will work if the index today remains weak (i.e. Open up, then tank again). The problem with this SHORT trade is that the profitability of SHORT trades is shrinking each day we close down: we already had 2 big days down, this would be the third day down in a row and we are also reaching LONG price levels with very high probability of reversal, so in our view chasing a SHORT trade from here is a risky business and the possible gains are capped because we are reaching the end of the trading range (the so-called oversold price limit).
If the market can bounce back to higher levels, possibly above 1800, then the odds to go SHORT would become very good (see screenshot above) and a SHORT trade from there would have a very good chance to generate good gains if the market tanks again.
Here below is what we have written last week, before the correction, we are re-posting it here so you can see the continuum between our daily advice posts (and if the market eventually matches our forecast or not):
If you are chasing a SHORT trade, this could be a good entry point, in fact you should be already SHORT and waiting to see if the market will give in and go down and give you a good profit. If this happens, you can figure out where to lock in your SHORT profits using the LONG calculators in the LONG section: they will tell you when the probability to have another upward move or bounce is high, so you can exit before the reversal. Our tools are basically quantitative market timing tools for swing traders, LONG and SHORT.
Copyright © 2014 Retracement Levels. All Rights Reserved
Comments
No comments yet.

