View: ES Quantitative Analysis | Slope of Hope
ES Quantitative Analysis | Slope of Hope
Here is a question that we have often heard in regard to our approach to market analysis:
“You never mention the news. Don’t you think the news affect market behavior?”
It is a legitimate question, and the answer is: “Our model already factors in the news, before they even come out, so we don’t need to check the news”.
How is that possible?
Very simple, each past price trend change, whatever its driver (news or market participants action) is documented in our multi-year quantitative databases. For example, if Bernanke said something some years ago, and if that caused a change in the price trend, our quantitative model recorded it.
So, if next February Janet Yellen will say something, we already know how the market will move.
We know it because we are able to detect today’s patterns and match it with the past patterns and we can assure you the market always repeat itself, if you know how to look at it.
What we are trying to say is that we don’t really care what Yellen or Bernanke (or Greenspan) said. We don’t care about the news because we would be too late if we wait for them to come out to take action (that is herd behavior and dominates the lowest realms of human psychology, including financial markets).
Instead, we front-run the news: we position ourselves before the news are public and we can do that thanks to our quantitative models, identifying price levels that have a high-probability of seeing a trend reversal: if a price level is hit, our orders will be already sitting there long before the news came out.
If you compare our price levels with typical TA indicators you will see clearly what we mean: MACD, Stochastics, MA, etc., they always give a temporary signal that changes as soon as the market changes. That is why they always say a signal must be “confirmed”, because none of these signals is reliable. They appear on the screen, you take the trade and then they disappear later, so you should have not taken the trade, but how were you supposed to know?
Our price levels instead are fixed: they stay there for the entire trading day and they won’t change, if a level is hit the signal is 100% valid and it won’t disappear later and it does not require any confirmation from other signals, so you can take the trade (with a Stop Loss).
Think about it, it is a key difference with all the other indicators.
TO GO LONG ANALYSIS
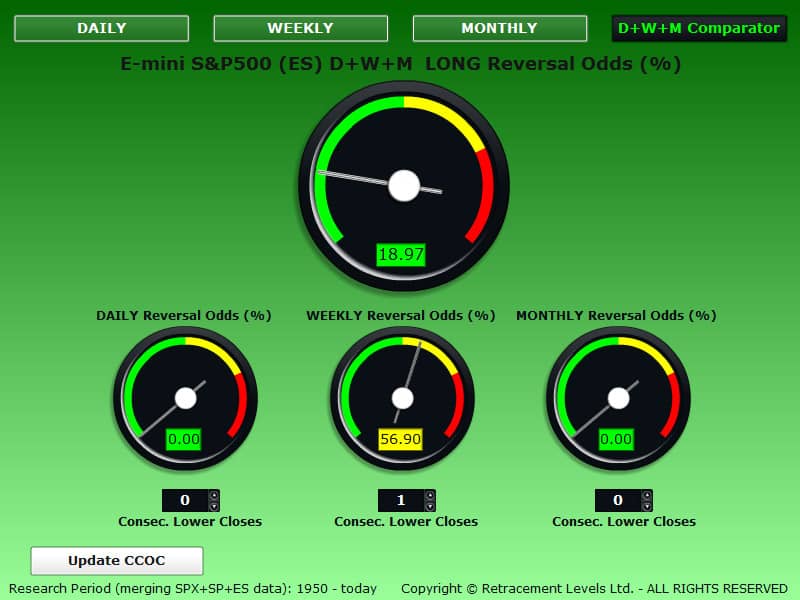
TIME STRETCH PERSPECTIVE (number of consecutive negative closes):
the CCOC DAILY gauge below is showing 0% odds to GO LONG, however from the end of last week we had the Weekly with 56.90% odds to have a LONG WEEKLY reversal, and in fact this week is up, so far. The MONTHLY is not supporting a LONG trade because lately the ES has been closing UP every month (the ES should close DOWN to show good odds to go LONG).
PRICE STRETCH PERSPECTIVE (price distance from the Last Close):
the LONG Odds (%) Comparator below show us the price ranges (squared in yellow) where you have the highest probability of seeing a LONG trend reversal .
The gauges indicate what are the odds at the price levels indicated by the yellow arrows.
When you have a good probability (>50%) on ALL the time periods, the LONG setup gains stronger validity.
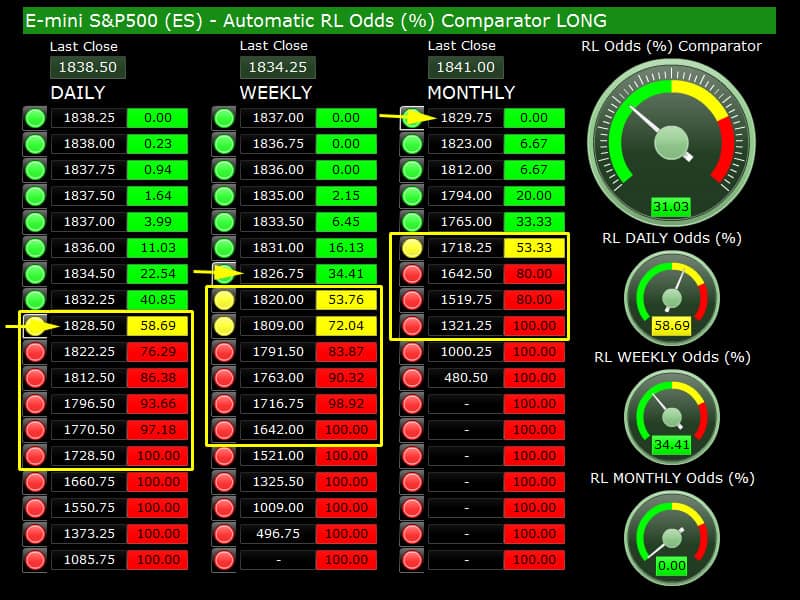
LONG Market Analysis/Comments:
The 1828-1826 price area has good odds on DAILY and WEEKLY time periods, so a trade in this area can be successful.
Overnight the ES spiked down to 1828.75, so we are almost there, our 1828.50 level may be hit intraday if the correction continues. The DAILY odds are good there, however to see a good combination DAILY+WEEKLY we must wait for the 1822.50-1820 price area.
TO GO SHORT ANALYSIS
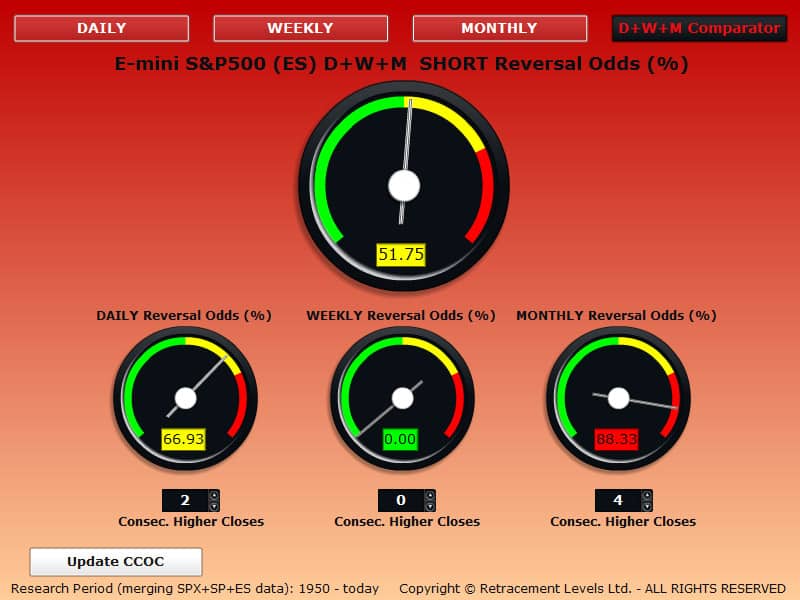
TIME STRETCH PERSPECTIVE (number of consecutive positive closes):
the CCOC DAILY gauge below is showing >66% odds to GO SHORT, however the MONTHLY is showing >88.33% odds (as long as the price stays above the latest Monthly Close at 1841). This reading is always done at market Close, it is based on the number of consecutive up Close prices and you should take immediate action right there, at Close. It is basically saying that there are >66% odds to see the market closing down today.
PRICE STRETCH PERSPECTIVE (price distance from the Last Close):
the SHORT Odds (%) Comparator below show us the price ranges (squared in yellow) where you have the highest probability of seeing a SHORT trend reversal.
The gauges indicate what are the odds at the price levels indicated by the yellow arrows.
When you have a good probability (>50%) on ALL the time periods, the SHORT setup gains stronger validity.
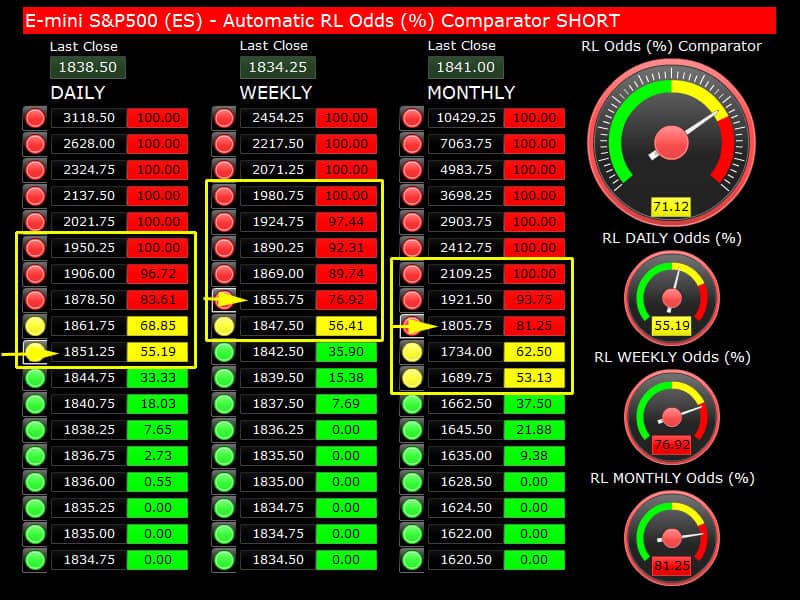
SHORT Market Analysis/Comments:
The comments made yesterday stand:
the 1851-1855 price area has very good odds on DAILY and WEEKLY time periods, a trade in this area can be successful. We have been suggesting in the last few days that the market may be ready to roll over and close the month of January down. That does not mean “Bear Market”, obviously, just a correction.
If you are chasing a SHORT trade, this could be a good entry point, in fact you should be already SHORT and waiting to see if the market will give in and go down and give you a good profit. If this happens, you can figure out where to lock in your SHORT profits using the LONG calculators in the LONG section: they will tell you when the probability to have another upward move or bounce is high, so you can exit before the reversal. Our tools are basically quantitative market timing tools for swing traders, LONG and SHORT.
Copyright © 2014 Retracement Levels. All Rights Reserved
Comments
No comments yet.

