View: ES Quantitative Analysis | Slope of Hope
ES Quantitative Analysis | Slope of Hope
Notes:
1) We know that our analysis is completely different from anything seen before and also it is hard to swallow for die-hard technical chartists, so we want to thank you all for your continued interest and support.
2) We have tried to further simplify our presentation of the product, now slimmed down to only 4 screenshots, 2 LONGs, 2 SHORTs, 2 are focused on the TIME stretch analysis (Consecutive Closes) the other 2 are focused on the PRICE stretch analysis (Odds % Comparators), and they all combine the analysis on 3 main time periods: Daily, Weekly and Monthly.
3) Recently someone in the SOH forum commented that the smaller time periods cannot predict the longer time periods, but that statement reveals complete ignorance of the basic nature of time periods (i.e. how they are actually created).
Maybe it helps to write here a small Data101.
First of all, there is only one type of data: sub-second TICK DATA, in other words data that records any small price variation at a sub-second frequency. That data is then artificially sliced using fixed time intervals (for example 1 minute, 5 minutes, 1 day, etc.) and during this re-sampling process the Open, Close, highest peak and lowest peak in the time interval are selected and they became the OHLC that compose each candlestick/bar. This data is completely artificial, man-made, and created for various purpose (i.e. chart plotting, analysis, etc.).
When we look at a single time period data, for example Daily, we are actually looking at a continuous set of TICK DATA that has been interrupted several times with artificial, arbitrary, temporal intervals. The same happens with the Weekly data, Monthly data, etc. This means that each of the larger time periods actually “contains” the smaller time period because they are basically the same thing, is just that the larger time periods (e.g. Monthly) contain a larger re-sample of the original source raw TICK DATA.
In conclusion, this is a quite complex subject, but we can say safely that the smaller time periods are a sub-set of the larger time periods and they can be effectively used, in the context of our analysis, to predict longer time periods price swings.
TO GO LONG ANALYSIS
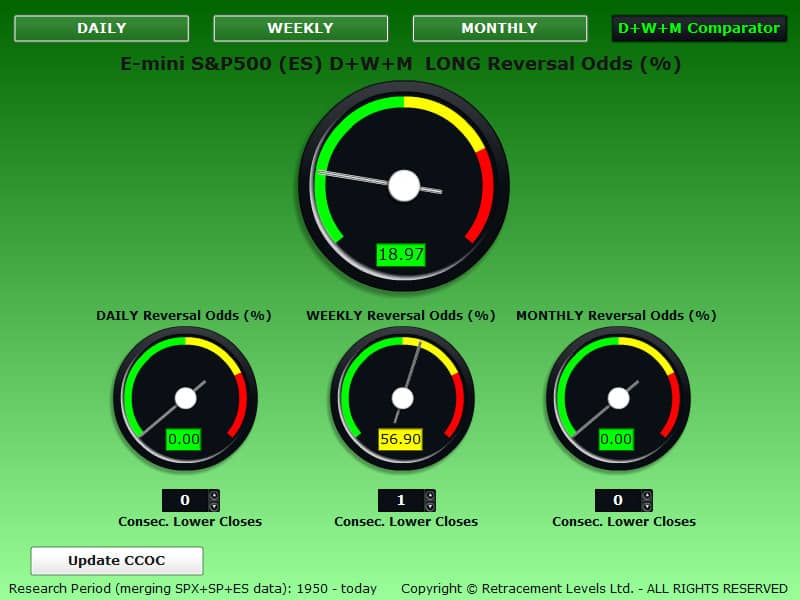
TIME STRETCH PERSPECTIVE (number of consecutive negative closes):
the CCOC DAILY gauge below is showing 0% odds to GO LONG, however from the end of last week we had the Weekly with 56.90% odds to have a LONG WEEKLY reversal, so it is possible that this week continues higher, just the occasion to fine tune the entry on the DAILY time period is gone (it was when the ES was closing DOWN). The MONTHLY is not supporting a LONG trade (this means that it takes at least 1 negative MONTHLY Close to have a chance to see a LONG trend reversal next month, lately the ES has been closing UP every month).
PRICE STRETCH PERSPECTIVE (price distance from the Last Close):
the LONG Odds (%) Comparator below show us the price ranges (squared in yellow) where you have the highest probability of seeing a LONG trend reversal .
The gauges indicate what are the odds at the price levels indicated by the yellow arrows.
When you have a good probability (>50%) on ALL the time periods, the LONG setup gains stronger validity.
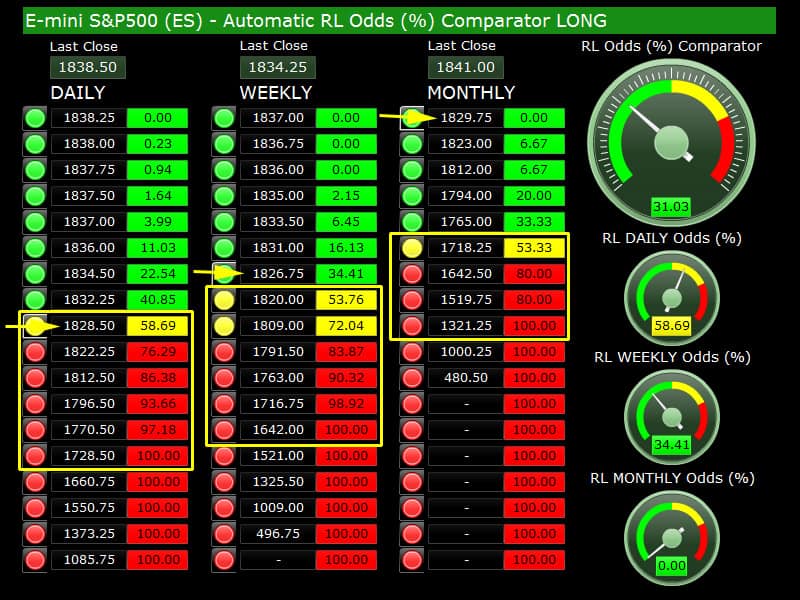
LONG Market Analysis/Comments:
The 1828-1826 price area has good odds on DAILY and WEEKLY time periods, so a trade in this area can be successful.
TO GO SHORT ANALYSIS
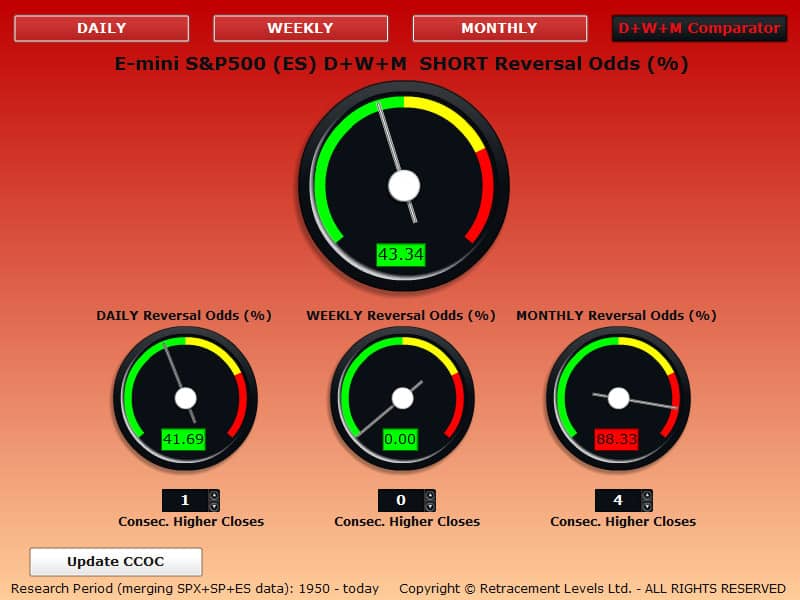
TIME STRETCH PERSPECTIVE (number of consecutive positive closes):
the CCOC DAILY gauge below is showing >41% odds to GO SHORT, however the MONTHLY is showing >88.33% odds (as long as the price stays above the latest Monthly Close at 1841).
This means that any time the DAILY and WEEKLY show good odds, the MONTHLY will add is weight to it, making a MONTHLY correction quite probable (as soon as the price goes below 1841 the MONTHLY correction setup is satisfies, in other words you have to go SHORT when the price is above 1841, to anticipate the SHORT trend reversal).
PRICE STRETCH PERSPECTIVE (price distance from the Last Close):
the SHORT Odds (%) Comparator below show us the price ranges (squared in yellow) where you have the highest probability of seeing a SHORT trend reversal.
The gauges indicate what are the odds at the price levels indicated by the yellow arrows.
When you have a good probability (>50%) on ALL the time periods, the SHORT setup gains stronger validity.
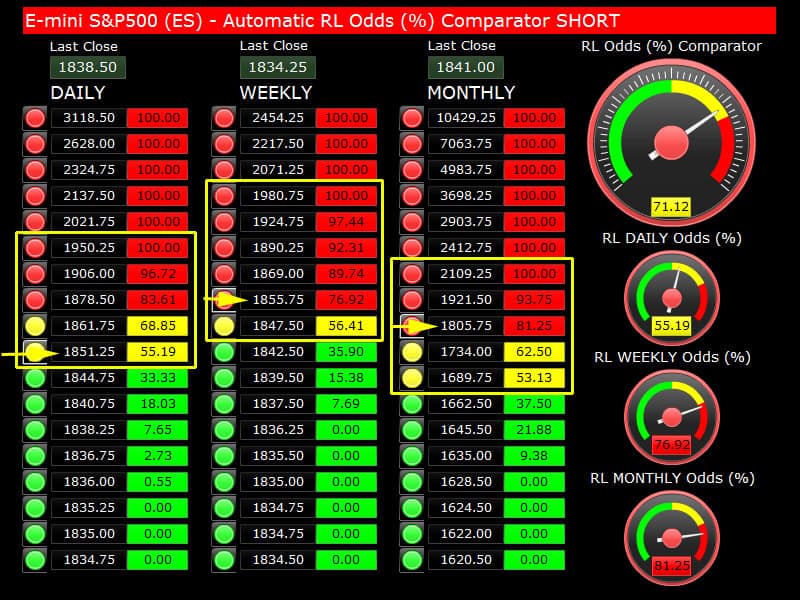
SHORT Market Analysis/Comments:
The 1851-1855 price area has very good odds on DAILY and WEEKLY time periods, a trade in this area can be successful. We have been suggesting in the last few days that the market may be ready to roll over and close the month of January down. That does not mean “Bear Market”, obviously, just a correction.
If you are chasing a SHORT trade, this could be a good entry point, in fact you should be already SHORT and waiting to see if the market will give in and go down and give you a good profit. If this happens, you can figure out where to lock in your SHORT profits using the LONG calculators in the LONG section: they will tell you when the probability to have another upward move or bounce is high, so you can exit before the reversal. Our tools are basically quantitative market timing tools for swing traders, LONG and SHORT.
Copyright © 2014 Retracement Levels. All Rights Reserved
Comments
No comments yet.

