View: ES Quantitative Analysis | Slope of Hope
ES Quantitative Analysis | Slope of Hope
TO GO LONG ANALYSIS
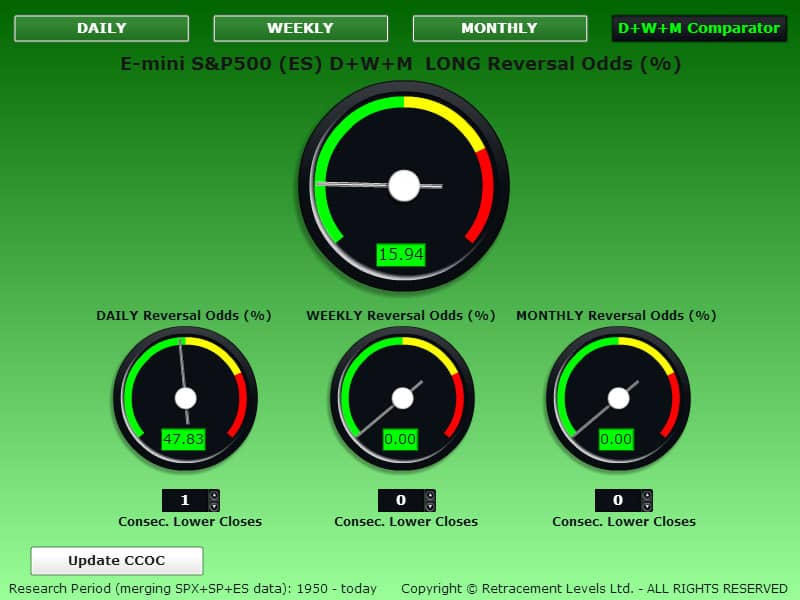
The CCOC DAILY gauge below is showing coin flip odds to GO LONG.
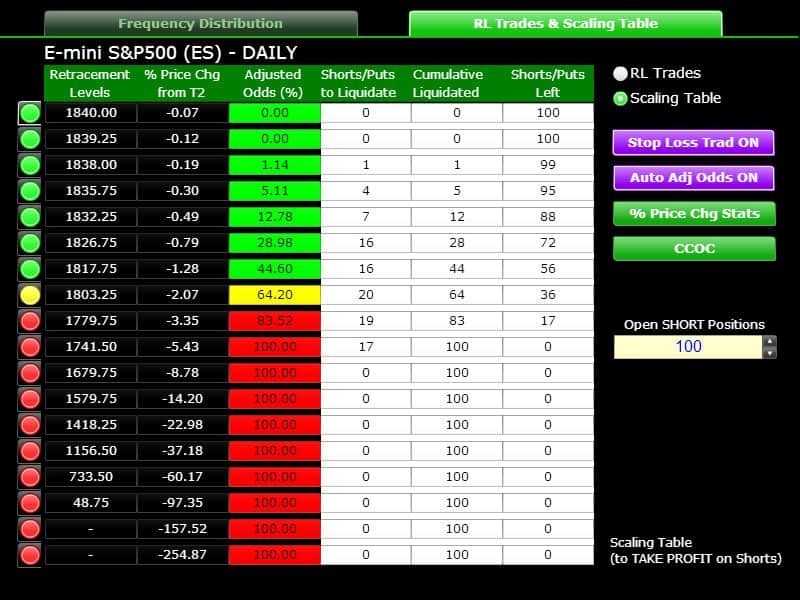
On the LONG Odds Table below we have the following relevant levels:
1741.50, 100% odds – Stop Loss level.
1826.75, 28.98% odds - First valid level to go LONG for the next trading session.
1817.75, 44.60% odds – First “safe” level to go LONG for the next trading session.
Yesterday the ES pulled back a bit from the previous day’s highs, but not much, it did not reach the LONG levels indicated yet, it may reach them today if the correction continues, however it is not yet clear if yesterday’s pullback was anticipating further downtrend for today or simply a “station” on the way up.
Generally speaking, given the fact that the ES is quite overbought Monthly, we do not like to buy early dips at this stage, we prefer to wait for good odds, so the 1817.75 level is more appealing than the 1826.75, but obviously it is further away and harder to reach.
The ES LONG Odds Comparator below tells us what the odds to go LONG would be if the 1826-1823 price area would be reached: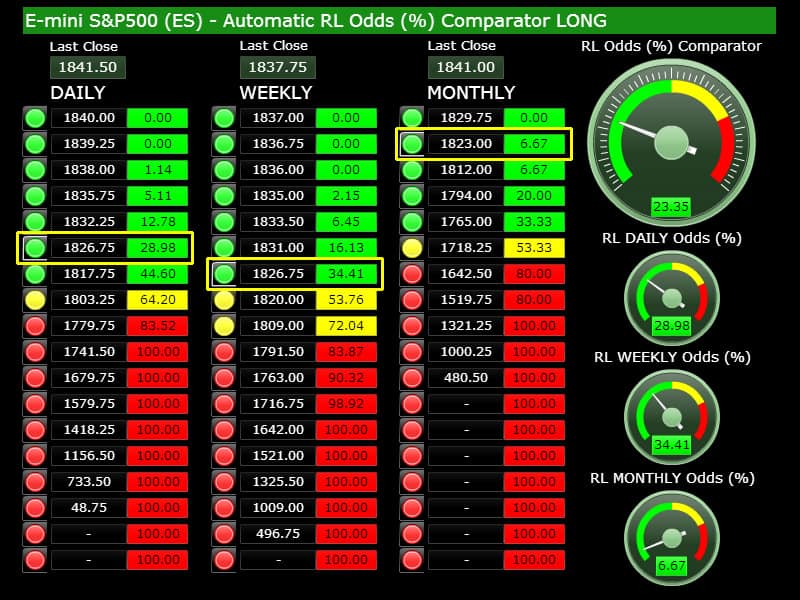
The overall odds (23.35%) aren’t particularly good for this trade, this trade will work if the market continues its upward march, i.e. in a buy-the-dips context – but it has to be seen if the ES can reach 1826.75 today.
TO GO SHORT ANALYSIS
The CCOC DAILY gauge below is showing 0% odds to GO SHORT (that is because yesterday the market closed down and so the odds to have a SHORT reversal are now zero because we were already in a SHORT reversal at yesterday’s Close – this is a Close-to-Close analysis tool to take trades at Close).

On the SHORT Odds Table below we have the following relevant levels:
1920, 100% odds – Stop Loss level.
1848.50, 62.50% odds – First “safe”/valid level to go SHORT.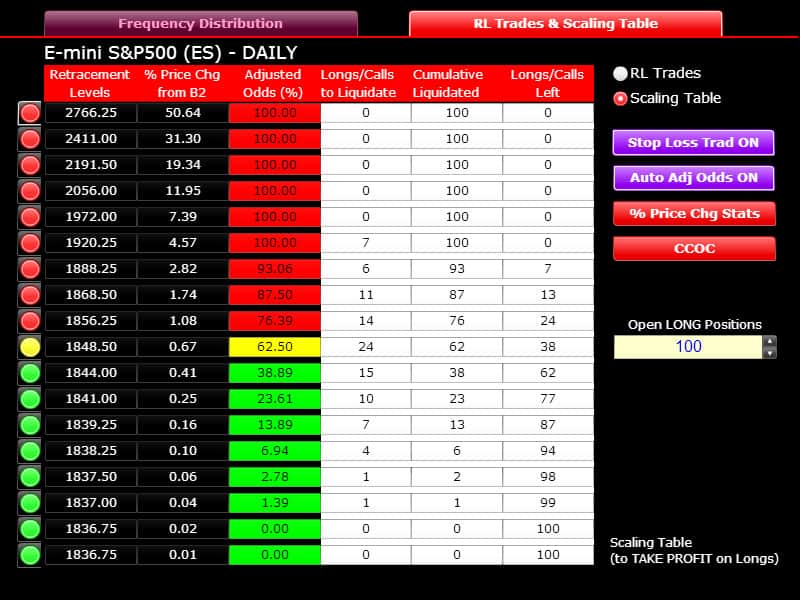
If today the index re-starts the uptrend, it could reach higher than 1848.50 in the next few days, however you can begin to go SHORT from there and also at 1856.25. What we are trying to do in this phase is to gauge as precisely as possible a SHORT trend reversal that may happen on the Monthly time period (because the Monthly time period is very overbought and so it is ripe for a correction). A Monthly time period correction usually last for 2-4 weeks and the correction, given the size of the Monthly price moves, could be between 50 and 100 points (more if the correction becomes nasty).
What we have said above does not mean that there will be a correction for sure, of course, nobody can predict that, we are just saying that it is becoming more and more likely to have a Monthly correction because of the excessive Monthly price extension, both in terms of TIME (4 months up in a row currently) and in terms of price (>81.25% odds).
The ES SHORT Odds Comparator below tells us what the odds to go SHORT would be if the price area around 1848 is reached/breached:
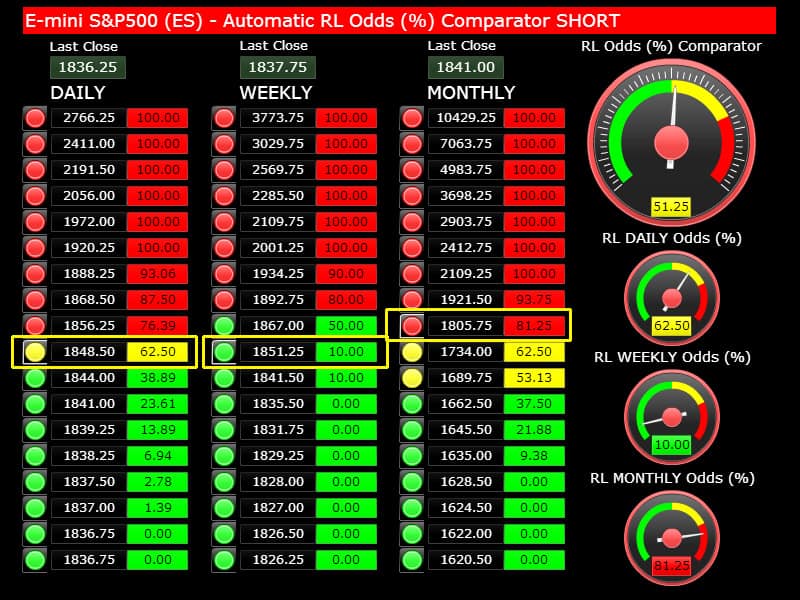
The Daily odds would be good (62.50%) and the Monthly as well (especially because the ES would be above the last Monthly Close @ 1841 and that reinforces the SHORT setup from the CCOC TIME perspective: 5 months up in a row).
What remains weak is the Weekly perspective, only 10% odds, but the Monthly is good enough to insist on the SHORT side from here. Should the market rise to 1867, then the Weekly will have 50% odds and at that point all the odds on ALL the time periods would be clearly indicating highly overbought levels and a correction would become very probable. This may happen in the next few days.
Copyright © 2014 Retracement Levels. All Rights Reserved
Comments
No comments yet.

