Browse Stacks: Business: Real Estate
slopechart_ABNB.jpg
Nov '23 trend line failure today

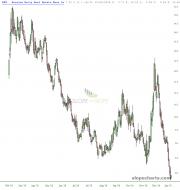
slopechart_KRE.jpg
Support around 42
slopechart_OPEN.jpg
Dec 2022 trendline broken
slopechart_OPEN.jpg
Oopsendoor
slopechart_OPEN.jpg
OPEN holding better than I would prefer
slopechart_Z.jpg
tryin'
slopechart_ITB.jpg
ITB weak today
slopechart_KRE.jpg
tough short...
slopechart_Z.jpg
testing resistance
slopechart_Z.jpg
Nice puke today
slopechart_OPEN.jpg
open for more downside
ggg.png

slopechart_OPEN.jpg
finally coming down a bit from nosebleed levels
slopechart_OPEN.jpg
Open to a fall
slopechart_NAIL.jpg
hit it, monkey
1
slopechart_ITB.jpg
lofty
slopechart_OPEN.jpg
tough one
slopechart_IYR.jpg
Getting there...?
Nashville-vacancy-rate-1.png (1000×621)
National-Airbnb-2.png (1280×952)
1
CS national.jpg (700×499)
case mish.jpg (700×426)
global house price drop.jpg (677×397)
Global house prices falling is recessionary
slopechart_VNO.jpg
wowser
slopechart_SLG.jpg
commercial RE plunge
wm6al35xvcma1.png (680×369)
slopechart_ITB.jpg
Home builders testing short term support
San Francisco Bay Area Housing Market Crashes, Prices Plunge 35%...
San Francisco Bay Area Housing Market Crashes, Prices Plunge 35%...
3bbhbluxf2ea1.png (640×509)
A look at house payments vs income ratio. Housing market has never been this unaffordable (in history
1
fredgraph.png (700×866)
Asset Value of Household Real Estate, 1987-2022
3
fredgraph.png (700×716)
Housing Production Versus House Prices Since Q2 1995
2022-11-18_07-02-44.jpg (929×579)
Y/Y And M/M Existing Home Sales, 2005-2022
3
image-10.png (979×780)
image-12.png (980×778)
image-13.png (979×780)
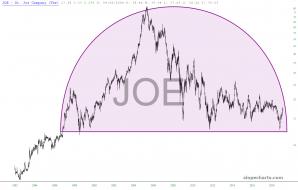
slopechart_JOE.jpg
50/100 MA Cross. Seems a decent chart.

Contra Corner Why The Fed Is Gonna Break Some Serious Financial...
slopechart_ITB.jpg
Getting close to the trend line
2022-10-25_06-03-00.jpg (937×575)
Home Prices Plunge Most Since 2009
2
slopechart_ITB.jpg
Lots of room to the downside
2
case shiller plunge_2.jpg (1279×694)
Home Prices Crash At Fastest Pace Since Lehman Bankruptcy
2
average home selling before list price.png (1200×900)
1
mortgage payments up 38%.png (1200×900)
2022-08-23_07-12-38.jpg (1007×542)
Months Supply of New Homes, 2000-2022
3
housing starts permits aug 22.jpg (1238×631)
Housing Starts Crater In July As Bottom Falls Out Of The Market
home buyer vs home builders.jpg (1236×631)
NAHB Aug 2012.jpg (1237×631)
Homebuilder Confidence Plummets For 8th Consecutive Month, Worst Slump Since 2007 Crash
1
unnamed (6)_440.png (847×463)
It's nice to see that humanity still has SOME intelligence left. What a wipeout! Wow!
fredgraph.png (700×816)
Owners’ Equity in Real Estate, 2000-2022
vklrdzvwv3c91.jpg (640×684)
1
zillow rents up.jpg (554×420)
fredgraph.png (700×718)
Median Home Sales Price Versus 30-Year Mortgage Rate, 1980-2022
2
fredgraph.png (700×718)
1
chinese real estate.jpg (554×403)
Contra Corner Amsterdam Real Estate Prices Highest In 400 Years...
Amsterdam Real Estate Prices Highest In 400 Years
5
bfm7AA0.jpg (994×562)
apartment list vs oed sept 2021_0.jpg (890×612)
china empty housing_0_0.jpg (579×366)
china net worth.jpg (680×513)
Holy shit!
fredgraph.png (700×718)
Here's the record-high house price index.
FUN FACT: The government conveniently doesn't include housing prices...
2
bfm2A34_1_0.jpg (948×519)
case shiller cities May 2021.jpg (1136×741)
Home Prices Soar At The Fastest Pace On Record As Affordability Hits All Time Low
1
bfmA82E.jpg (979×560)
US Home Prices Have Never Risen This Fast
2021-07-26_7-05-29_0.jpg (1280×837)
1
fredgraph.png (1000×670)
Case-Schiller Versus Owners Equivalent Rent, 2000-2020
slopechart_VNQ.jpg
https://www.msn.com/en-us/money/realestate/the-new-real-estate-normal/ar-AAMir6k
Maybe VNQ breaks up when the tri...

fredgraph.png (700×718)
Number of Hours To Purchase the Median Price Home For Average Wage and Salary Worker, 1986-2020
1
fredgraph.png (700×718)
House Prices Versus Index Of Average Weekly Earning, 1998-2021
3
fredgraph.png (850×670)
1
existing home sale price 6.22.jpg (1112×618)
1
slopechart_VNQ.jpg
The Rent's Too Damn High! At least compared to the regression line I previously drove through this one.
fredgraph.png (900×620)
Labor Hours At Average Hourly Wage To Purchase A Median-Priced Home, 1965-2020
1
bfmFB88_0.jpg (960×502)
slopechart_VNQ.jpg
VNQ will break loose above 100 late this Summer.
slopechart_EQR.jpg
May be time to catch the old counter trend rally long with a target of the 180 EMA or the bearish trendline. You c...

slopechart_GEO.jpg
Prison REIT yields 16%. Green trendline starts on 12/18/2000 @ 59 cents

slopechart_XLRE.jpg
Top 11 holdings (65%) look pretty weak
3
VolatilityGrid_AAPL,FB,GOOGL,HD,INTC,MSFT,NVDA,T,V.jpg

migration.jpg
Interesting map.

1
homebuilders-testing-2000-highs-dec-3.jpg (1556×827)
ShareDebt.jpg
Mortgages account for most U.S. household debt.
2019-10-01_5-23-48.jpg (659×482)
2019-08-09_6-20-07.jpg (657×477)
2
bfm776D.jpg (976×510)
New Home Sales Miss As Mortgage Rate Collapse Fails To Bring Buyers Back
8
2019-07-24 (1).png (512×338)
purchasers.png (330×423)
2019-06-25_0.png (512×338)
Median prices of new homes tumbled from $335.1K to $308K, lowest since Jan 2019...
bfm6BCA.jpg (976×506)
Existing Home Sales Tumble YoY For 15th Month - Worst Run Since Housing Crisis
2
sv 4.png (810×438)
slopechart_JOE.jpg
Sector: Real Estate: Land Subdividers and Developers
1

2019-04-23.png (834×551)

2019-04-18_16-15-06.jpg (641×365)
Half Of England Is Owned By 1% Of The Population
2

bfm7374.jpg (976×507)
Slowdown in homebuilding
1
slopechart_DRV.jpg
Inverse of DRN
1
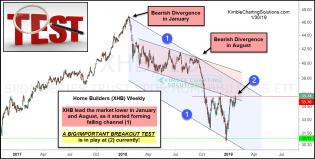
homebuilders-facing-important-breakout-test-jan-30.jpg (1265×642)
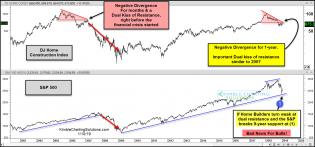
home-construction-repeating-2007-pattern-dec-10-1.jpg (1569×736)
XHB
1

homeownership.jpg
Home ownership in Europe.
![Housing Units - Median Year Built [OC] : dataisbeautiful](https://s3.amazonaws.com/cdn2.socialtrade.com/st/shards/23979_ubLK2rgS_h)
Housing Units - Median Year Built [OC] : dataisbeautiful

slopechart_ELS.jpg
Off work, trawling for clues. Interesting trend line and price. Breaking the rules a bit for applying a trend, but...