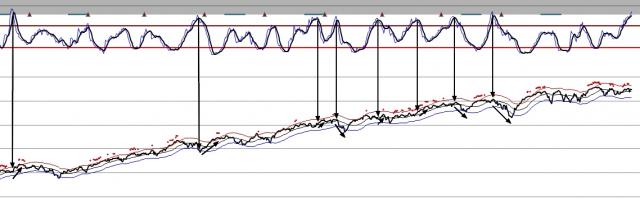
I made this up for myself over a year ago. It is a stockcharts scan looking for John Carter's Squeeze as measured by the width between the bollingers being less than the width between the keltners. You can see that most times it gets this high, the market tends to have a large move afterwards. We are now on the cusp. A few times, the market has continued in a non-explosive fashion and just as much up as down so no major "hint" here. Although, I will say that the up moves tended to be much smaller than the down moves when they happened. Basically, when the next move gets going, it should keep going for a while, no matter the trend. 4/21/15
 Closing Basis - go with the flow
