Date: February 16, 2013
Daily chart: Danger of death! | The Economist
How we die

goldsupport1300feb151.gif (1575×728)
Gold finds itself at a very important test of support at (1) in the chart above at the top of its falling channel....
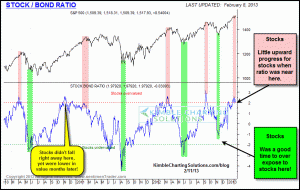
stockbondratio2feb11.gif (871×550)
Stock/Bond ratio is suggesting to underweight stocks for a while!
2

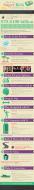
020113-airlines-v3b.png (956×787)
How the USA Ended up with only 4 Airlines
1

20130215_mktcapgdp.jpg (718×398)
"best single measure of where valuations stand at any given momen," US equities are now over-valued for the first...

equity to debt.jpg (730×598)
the ratio of equity market cap to the outstanding value of debt securities underlying this equity is near all time lows!

20130215_VIX1.jpg (1310×403)
Equity Volatility Plunges To 17 Year Low
How The Super Rich Avoid Paying Taxes
1

Since late January, the February gold contract has been in backwardation. This means that one could make a profit by simultaneously selling a gold bar and buying a February contract. One would still have one’s gold plus a little ext...
Gold Leaps Into Backwardation | Keith Weiner | FINANCIAL SENSE


seasonals-gold_eH9eJA_m.gif (640×300)
Gold seasonality
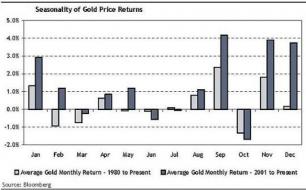
gold-seasonality_8iYqJN_m.jpg (640×397)