Log In
|
Create Account
Chart
Chart Lab
Drawn Objects ➟
Guide to Patterns ➟
Mobile Charting
Modes ➟
Power Features ➟
Reference Manual
Rotation Graphs
SlopeCharts
Video Guide to SlopeCharts
Equities
Biggest Companies
Correlations
Earnings ➟
Real-Time SlopeAlerts
Sector Performance
SlopeMATRIX
Symbol Search
Super Summary
Today’s Movers
Woulda Shoulda
Markets
Commodities
CryptoStream Live
Economic Database
End-of-Day Report
Macroeconomics
Market Meter
MetaSymbols
SlopeRules
The Matrix
Yield Curve Tool
Options
Backtest Strategies
Earnings Reactions
Options Analytics ➟
Payoff Analyzer
Price Cones
Strategy Explorer
Trading Strategies
Virtual Trading ➟
Volatility Calendar
Volatility Matrix
Read
Best Posts of All Time
Books by Tim Knight
Comments Search
Guide to Comments
Latest Posts
Mobile Apps
Profile of Your Host
Recommended Books
SlopeBot GPT AI
Watch Slope Videos
Social
Activity Feed
Browse Chart Database
Guide to SocialTrade
Hall of Fame
Members Directory
Published Watch Lists
Publishing/Subscribing
Search SlopeRules
SlopeTalk LIVE
Virtual Trading
Help
Best Pages For You
Guide to the Site
Membership Levels
Pattern Video Library
SlopeCharts Reference
SlopeMatrix Guide
SlopeRules System Builder
SlopeTiles Customization
Using SlopeTalk
Video Guide to Slope
Log In
Create Free Account
Memberships
Date
:
February
23, 2013
$SPX
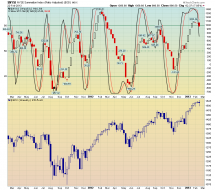
SPX daily with 3 and 10 EMAs (2/22/13) The short term MAs have crossed over.
$NYSI
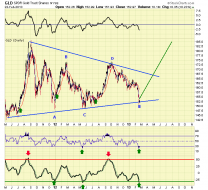
NYSE Summation Index weekly with slow stochastics (5,3) (2/22/13) The intermediate term top signal is in place. T...
$SPX
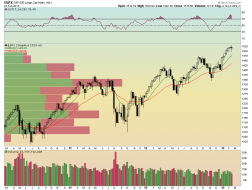
SPX weekly with 13 and 34 EMAs (2/22/13) The long term trend remains bullish
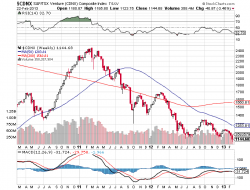
$CDNX
cdnx
6a014e5f6975b2970c017c370b9c9e970b-pi (700×639)
Current Market Snapshot
Good 'ol Serge BIG Red Doji candle on the S&P Weekly Chart.... Might be Bearish Engulfing, too.