Date: February 4, 2013
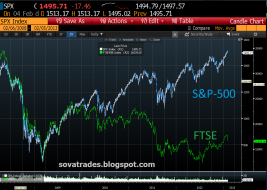
SPXFTSE.png

1.gif
ALL SECTORS RED-TODAY

FB_Daily_2_4_13.png
We don't need no stinking Fibonacci's!
5 drives to a high. First possible bounce-point is 26.79.


EUR DAILY.png
$EURUSD: It will dictate over the extent of the equity pullback

hygjnksupportfeb4.gif (1559×693)
High yield ETF's (JNK & HYG) are both on 16-month support lines in the 2-pack above. Each time these declines hav...

performancegloablstrengthfeb4.gif (910×324)
S&P 500 is very weak, compared to key global markets.

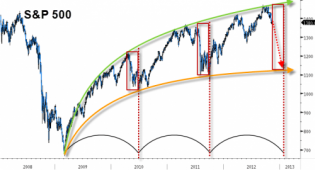
stock-market-cap.jpg (963×724)
Market Capitalization As A Percentage Of GDP

20130204_EOD3.jpg (718×382)
Stocks remain massively disconnected from credit

20130204_EU1.jpg (719×385)
Europe Plunges By Most In Six Months

spx 5 min 2.png
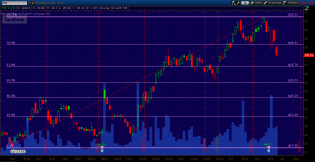
$SPX: Despite being corrective this time it feels different
Screen Shot 2013-02-04 at 11.36.11 AM.png
Normally we have seen a low of some kind based on this indicator. Let's see if this channel provides support soon.

spx 5 min.png
$SPX: Corrective but maybe this time it will be different
20130116_SPX.jpg (720×385)
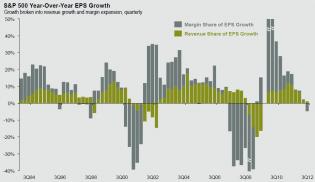
EPS-Growth.jpg (1057×614)

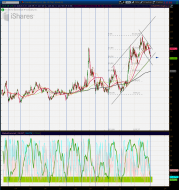
NDX DAILY.png
$NDX: Potential Double Top (But do not expect a major reversal)
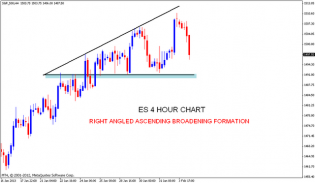
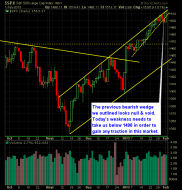
ES Ascending Broadening pattern | Nifty charts and latest market...
ES Ascending Broadening pattern


naaim
Managing other people's money... right into oblivion? NAAIM, your friendly contrary indicators have knee jerked wa...

Technical pattern of stock - $SPY TREND
Last week, I made a few posts that dealt with trading psychology of the average swing/momentum trader. Specificall...


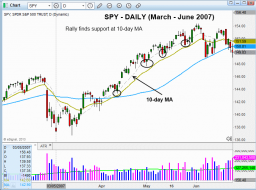
SPX DAILY.png
$SPX: If a pullback has been kickedoff it is required an eod print < 10 dma = 1499
S and P 500 Market Analysis 2-4-13


photo

ZN DAILY.png
$ZN_F : Failure of the Double Bottom = Positive for Risk On
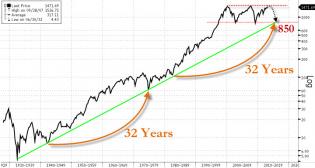
The Strange (and Worrisome) Symmetry Of Bernanke's Bull Market |...
I love the "Reminder" feature of SocialTrade, lets me revisitd those "predictions" :D

1