Date: March 26, 2014

ES 15 MIN.png
$ES_F Globex: An impulsive decline MUST be followed by a corrective bounce


spx 30 min.png
$SPX: 2 potential targets if decline off 0321 remains impulsive
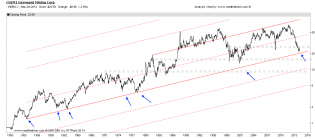
NEM 2

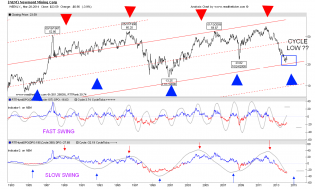
NEM 1

Cost2.png
COST: Update Head Shoulders. One of the most perfect head shoulders in a while. Betting the farm type opportunity :)

3
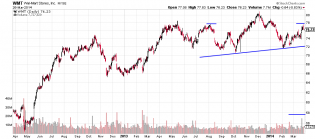
wmt.png
WMT: Wal-mart Head Shoulders Top prices are falling so is your stock.
5

sc (11).png

5
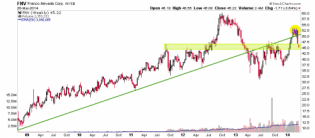
fnv
Here you go Dink... FNV showing what should be a strong support zone.

1

VXX DAILY.png
$VXX: It could be forming a bullish Triangle
1

GDX23-3-2014.png
An IHS for the miners?
2

cdn.socialtrade.com/comsys..._dyJYcv_m.png

SPX 5 MIN.png
SPX: This impulsive decline should belong to a wave (C) Double Top idea is back
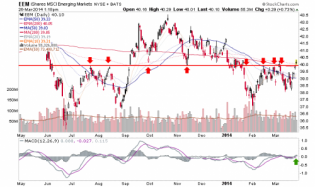
eem
Emerging market ETF is breaking above well defined lateral resistance.
3

SPX 5 MIN.png
$SPX: Wedging. Maybe a Leading Diagonal if next bounce establishes a lower high

$ORI - Continuation trade setup. Bearish Flag reached 61.8 retracem...

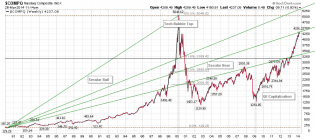
sc.png
Tech fib resistance holding so far .. a 30 year pattern .. we'll see what happens with the EOQ by Tuesday .. I hav...


SPX 5 MIN.png
$SPX: This corrective up leg is approaching a top. Next pullback will give clues
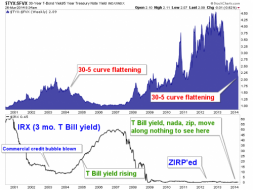
30.5.wk
Tell me Beuller, what's different about the current curve flattening from the Greenspan era flattening?

QQQ DAILY.png
$QQQ: Daily chart with few thoughts