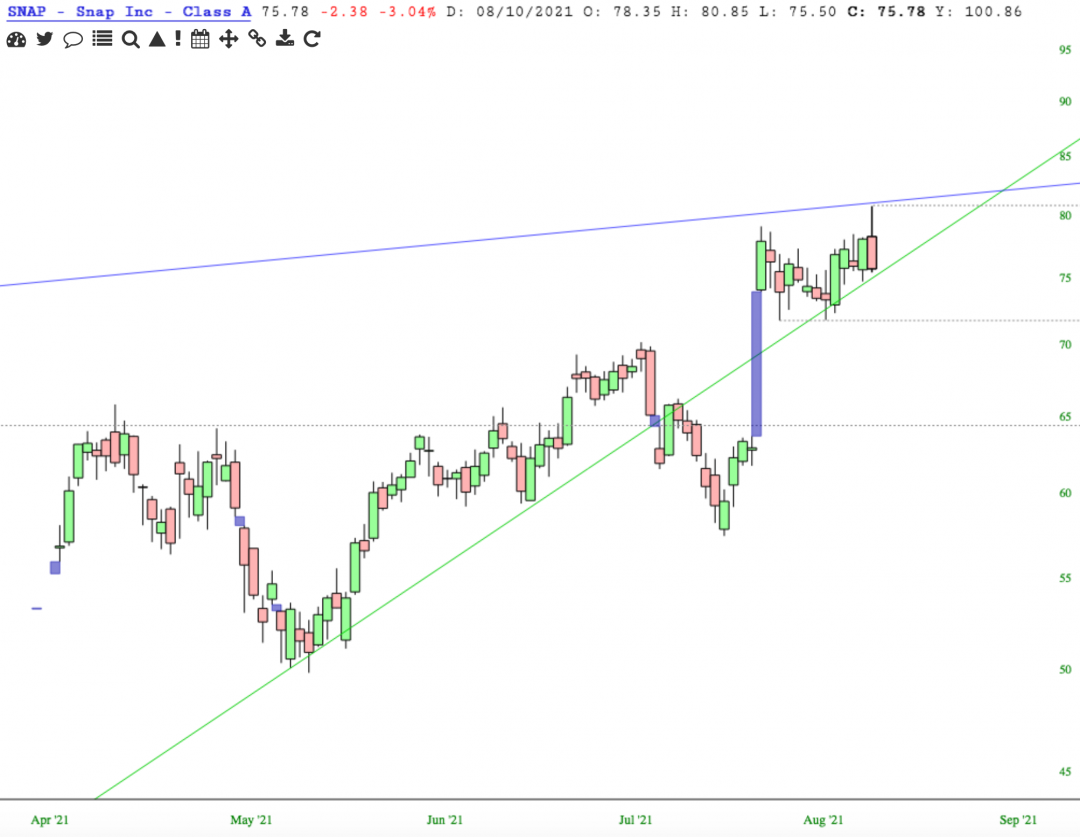
Higher lows and higher highs until there aren't. Have to move to a shorter timeframe if you want to look for a disciplined short entry . . .?
And there's those damned log charts. Would love to see TK make the Fib calcs change to log for log charts. Apples to apples, and all that . . . eh? 8/10/21
The high and low that needs be taken out in order to validate, or not, an island reversal, are marked. If price gaps down to validate a reversal, that would indeed be your lower low. What was your question?


And there's those damned log charts. Would love to see TK make the Fib calcs change to log for log charts. Apples to apples, and all that . . . eh? 8/10/21