Date: December 17, 2012

US Debt to GDP Since Independence_1.jpg (1153×699)
Charting US Debt And Deficit Since Inception
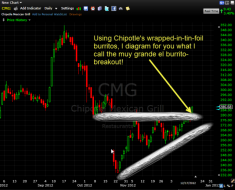
Chipotle CMG Burrito Breakout

2

clip_image003


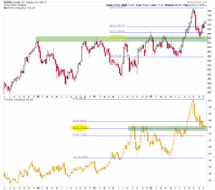
30yryieldbreakoutdec171.gif (1576×728)
Interest rate breakout
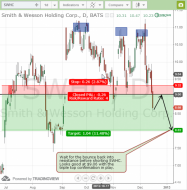
SWHC Smith and Wesson swing trade short triple top
S

globalperformce60daysdec17.gif (938×325)
International markets so far in 2012
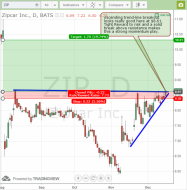
Zipcar ZIP ascending triangle breakout swing trade

global4packresistancebreakoutsdec17.gif (1567×718)
World stock markets

stocks-volume.png (795×548)
NYSE stock volume shrinking over the years

BA-BA513B_Outlo_G_20121215011209.jpg (555×1457)

MillionairesInfographic.jpg (950×1621)
Developing world's millionaires

20121215_INC644.png (595×376)
International Patent Applications (by country)

THE SQUIDMAS ALBUM

20121217_SPX_Bartels3.png (486×400)
2013 is the first year of a new Presidential Cycle. The first quarter of the first year of the cycle is down 1.33% on...

20121217_SPX_Bartels2.png (716×382)
S&P Transportation index is significant underperforming the Index...

20121217_SPX_Bartels1.png (720×400)
S&P 500 vs NYSE net new highs divergence...

20121217_SPX_Bartels.png (719×388)
S&P 500 vs NYSE Advance-Decline line divergence...

SPX73-2012.gif (545×397)
Next up, a long-term chart (from 1973 to the present) of the SPX, adjusted to the trade-weighted U.S. dollar. Were...

derivatives-SPX12-12.gif (545×399)
The first overlays bank derivatives with positive fair value against the S&P 500 (SPX), lagged 28 months. Is it cr...

The US fiscal cliff – a ticking time bomb! - uk.saxomarkets.com
Fiscal cliff infographic
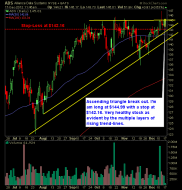
Alliance Data Systems ADS swing trading long setup

Image

QE 4: Folks, This Ain't Normal | Peak Prosperity
goog-rgld
Nice correlation between GOOG and RGLD, w/ GOOG offset forward a few weeks.
