Date: December 4, 2012
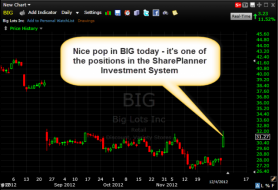
Big Lots BIG big move in the investment system

The short-term financial orientation of the investment
community is one of the greatest barriers we face to creating a sustainable
society.The corporate community has made significant progress since
2000 in planning for the long term....
Vast Pools of Money Still Ignore Sustainable Investing - Bloomberg


HOME GAME
In dampening each successive downturn, authorities accumulated increasingly larger deficits and brought about a de...

20121203_NTMPE.png (790×642)
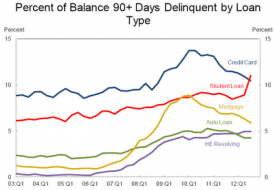
This is the only chart the retail investor needs to remember when bombarded day after day by the media with regard...

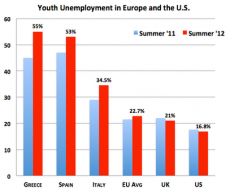
Europe Car Sales.jpg (1000×638)
The Unprecedented Implosion Of European Car Sales

part1202121_big.gif (970×728)
US Labor Force Participation Rate

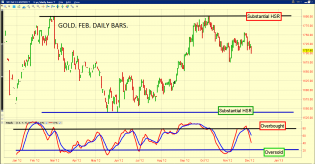
gold11yearsupporttestdec41.gif (1574×728)
Key support for gold

railsreversalpatterndec3.gif (1576×731)
The chart below reflects the S&P Railroad index broke out to the upside at the pattern suggested and the 500 index...

Valeant Pharmaceuticals VRX swing trade long
Mish's Global Economic Trend Analysis

Mish's Global Economic Trend Analysis
Mish's Global Economic Trend Analysis
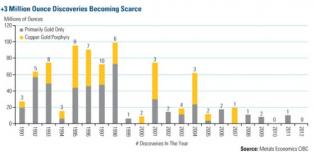
Golden Bullshine by Richard Mills
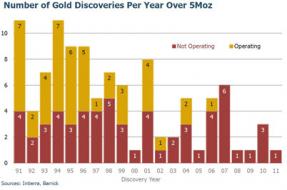
Golden Bullshine by Richard Mills
Dec 4, 2012 Is the Yen Doomed? Axel Merk 321gold ...inc ...s
2012dec4gold1.png 1,365×711 pixels
au
Gold weekly chart needs to hold EMA 35 (1690 or so) to remain 'normal' and in uptrend.

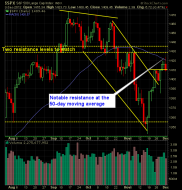
S and P 500 Market Analysis 12-4-12
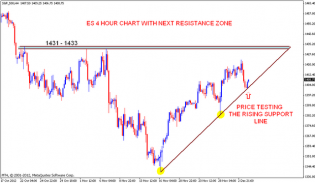
ES Support and Resistance levels | Nifty charts and latest marke...
ES Support and Resistance lines


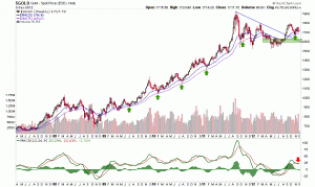
SSEA DAILY.png
SSEA: POTENTIAL BOTTOMING PROCESS


KBE 30 MIN.png
KBE: The internal structure suggets a sideways corrective pattern
SPX: FOLLOW UP OF THE SHORT TERM EWP
SPX: Follow Up of the Short Term EWP | The wave trading
SPX: FOLLOW UP OF THE SHORT TERM EWP