Date: December 7, 2012

Centralbankspercentofworldmarketcap


Globalpmi
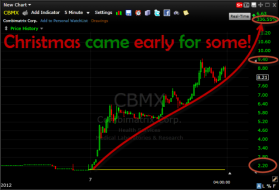
Combimatrix CMBX went through the roof


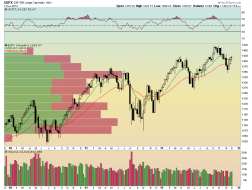
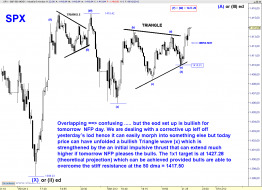
$SPX
SPX daily with 3 and 10 EMAs (12/7/12) bullish

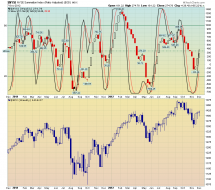
$NYSI
NYSE Summation Index with slow stochastics (5,3,3) weekly (12/7/12) byllish trend persists
$SPX
SPX weekly with 13 and 34 EMAs (12/7/12) Weekly doji and still bullish
Bearish Candlestick Reversal Patterns 12-10-12 - Stocks To Buy Forum
SWHC - Right out of the textbooks. It broke the prior resistance by only $.01 before selling off violently, lockin...


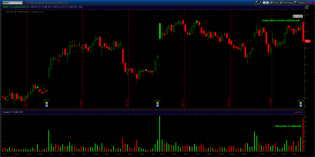
spx 30 min.png
SPX: Despite the overlapping structure the absence of an impulsive down leg = The trend remains up

mcdonalsvalueplaynov19.gif (1576×729)
joefridayappletripledsupportdec7.gif (1575×732)
Apple tripled in value in the past 3 years along rising support line (1) in the chart above. It has paid to buy A...
coffeefallingwedgebreakoutdec7.gif (811×667)
Coffee futures have been down hard over the past 18 months, losing 50% in value! This decline has created a large...
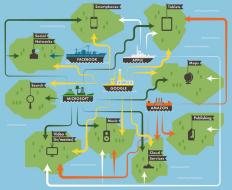
st_digitalworld2_f.jpg (660×539)
Nice illustration of the “epic struggles” that the tech giants — Google, Amazon, Apple, Facebook, and Microsoft...
1

LAbor Force Participation.jpg (1043×684)
Confused why the unemployment rate dropped? The same, favorite BLS adjustment - a drop in the labor force participati...

Jobs vs Average Hourly Earnings.jpg (1084×600)
In light of the composition of today's NFP pickup, driven by retail, waste and administrative and hospitality and...

dshort Featured Charts

KBE 30 MIN TRIANGLE.png
KBE: If the pattern is a Triangle then the outcome should be a thrust higher on FOMC day
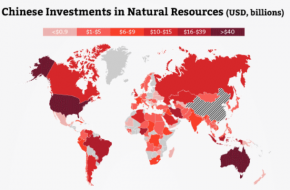
info chinese

The Shift from East to West: Chinese Investment in North America

EUR 15 MIN.png
EUR: Possible short term path
Mish's Global Economic Trend Analysis


Bluffer
I got your fiscal cliff right here!
usd_cork.gif 990×970 pixels

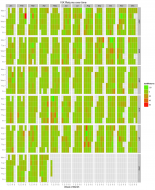
tablecomponents
Only nature can produce a perfect Apple

VIX_Season.png
VIX Seasonality - Heatmap


Total jobs since Obama by age - 2 groups.jpg (969×637)
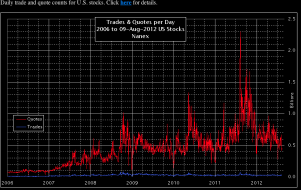
Screen Shot 2012-12-06 at 10.58.41 PM.png
Rise of HFT from 2009-....
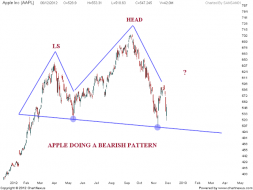
APPLE Chart update | Nifty charts and latest market updates
Apple bearish pattern and Death cross

1
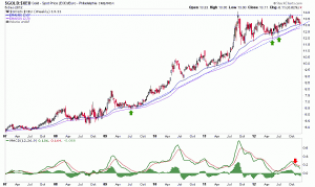
au.xeu
Gold in euros remains in a bullish Ascending Triangle

False flag or real?
A troubling video appears on YouTube showing rebel fighters test...
False flag or real?


eur 60 min.png
EUR: The trend is now officially to the down side
spx 5 min.png