Date: July 16, 2012
fomc2.jpg
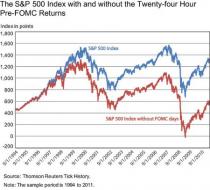
Did you know that to capture almost all return of the market since 1994, one need only be in the market 24 days a...

1
Google Image Result for http://2.bp.blogspot.com/-lxNLeGkdh5g/UACpY...

P
Thank You Serge Farra, Have a Great Vacation in France.

3
World Wide Daily Drought Risk Map - thanks to MovinFwd
World Wide Daily Drought Risk Map
World Wide Daily Drought Risk Map - thanks to MovinFwd
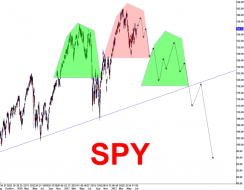
BT''s Timing Board (SPX AND TIMING): SPX/SPY review: almost all...
BT''s Timing Board (SPX AND TIMING): SPX/SPY review: almost all...
BT''s Timing Board (SPX AND TIMING): GLD DZZ holding 1/2 unit DZZ. Add
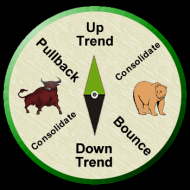
Stock-Market-Compass-Full-Uptrend

I am LONG GS from $97.60, roughly from the top of both the most recent Doji and white Fat-Tail. The Target for this trade is to fill the gap in the 106 area, for an...
bluechip bulldog: Goldman Sacks Group
I am LONG GS from $97.60, roughly from the top of both the most recent Doji and white Fat-Tail. The Target for thi...
1
Why Don’t the Corrupt Players On Wall Street and In D.C. Show Remorse for Their Destructive Actions … And Why Don’t We Stop Them?Many bankers, regulators and politicians have been caught in lie after lie and scandal after scanda...
Scandal After Scandal, Lie Upon Lie … What’s Going On? | The...

1

Testosterone Pit - CARTOONIST: BEN GARRISON


UNG


ggimage01_071612.png
1

Shorts Could Drive the Next Move in SLV | Schaeffer On Charts |...

SDS Call Open Interest Jumps to a New Two-Year High | Schaeffer...
spy-faz is 0.JPG
Inverse of SPY is FAZ?

The Midwest is facing a severe drought that is causing corn and soybean crops to wilt under severe weather conditions.The current temperature has exceeded records from the Dust Bowl era, and the drought is now spanning the widest area...
Jim Rogers: The World's Agricultural Problems Are Much Bigger Th...
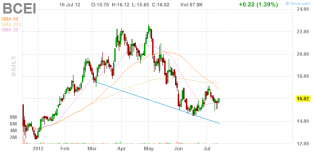
Stock Quote BCEI


original.jpg (1225×737)
OPEX during earnings season
1
$SPY trying to give all it's got to stay above? 135.14 level, but there could be an invert head and shoulder pattern building on a 5 min chart. I just mentioned in one of the chat rooms that this market looks like a total mess. Tradi...
Fuinhaz $SPY afternoon update for July 16, 2012 | SharePlanner
CORN weekly.png
"Here Comes" double top in CORN...weekly chart.
Once the market opens each day, it can be rather difficult to surmise which direction it will go by the end of the day. For some it seems like a a random walk in the park. But for me, as a trader, there have been countless observation...
How To Predict Market Action From The 1st Hour of Trading | Shar...

Jobs Chart and the S&P Suggest Drop
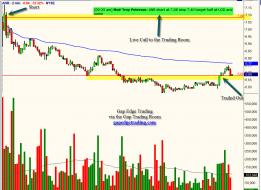
ANR short.jpg
ANR gap down short


Biiwii TA and Commentary: Another chart that is for all the marbles...
As long as the silver-gold ratio clings to support, the bulls can keep the rally going. This is a ratio of the re...

CORN.png
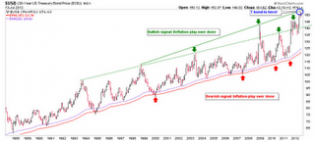
Biiwii TA and Commentary: Another view of the long bond...
Another view of the long bond... which way will it break, into upward blowoff or back toward the inflation end of...
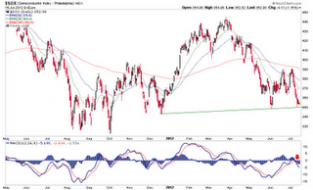
Biiwii TA and Commentary: Semi's look bad
Semiconductors are relatively... awful!
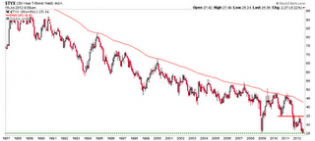
Biiwii TA and Commentary: No more room for yields to fall...
Chart says it all... yield continue to decline and everyone who reviled Prechter will be forced to recant.

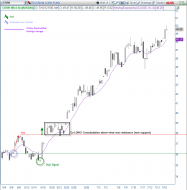
Biiwii TA and Commentary: Q: When does a series of higher highs...
Will short term uptrend turned Bear Flag in HUI that gave a signal in February correspond to the current short ter...
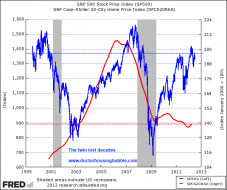
case shiller and snp 500 2012

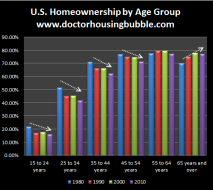
us-homeownership-by-age-group

Click to View

Click to View

COPPER Resistance levels | Nifty charts and latest market updates
Copper resistance levels

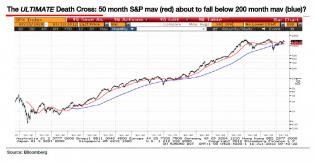
ultimate death cross.jpg (915×473)
Ultimate death-cross
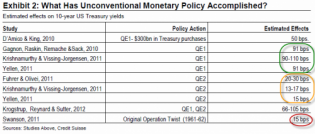
Does QE Really Work? The Evidence To Date | ZeroHedge
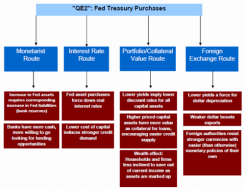
Does QE Really Work? The Evidence To Date | ZeroHedge

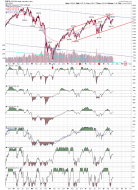
chart 1

Health of the Market
The top pane below shows the S&P 500. The red background indicates when at least a 4% drop has occurred (after at...
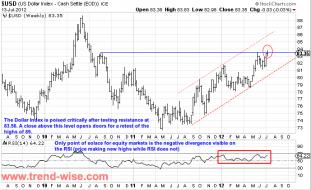
DXY - 13 Jul 12.jpg
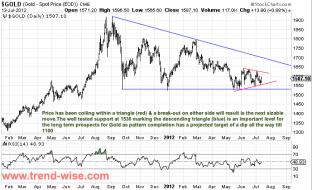
Gold - 13 Jul 12.jpg
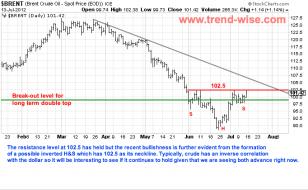
Brent - 13 Jul 12.jpg