Date: July 19, 2012
Investors continue to believe that the VIX is unnaturally low given the scope and magnitude of the future threats to equities. Should the ratio continue at its curr...
VIX and More: Crazy VIX:VXV Ratio Chart
Investors continue to believe that the VIX is unnaturally low given the scope and magnitude of the future threats...


Technical Analysis Volatility index S&P500 (VIX) - World Indices...

1
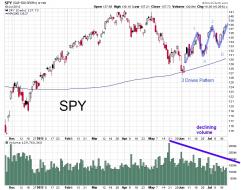
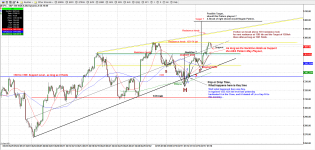
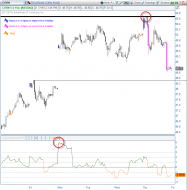
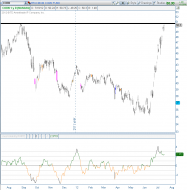
SPY July 19 3 Drives.jpg
3 drives pattern on declining volume

sc.png
My second post, this looks like a great entry point..

Conference Board Leading Economic Index:
"Sustained Weak Growth Through the Fall"
Conference Board Leading Economic Index Update
Conference Board Leading Economic Index:
"Sustained Weak Growth Through the Fall"
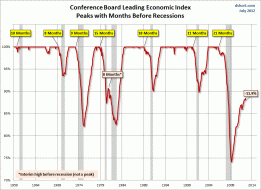
Conference Board's Index of Leading Economic Indicators
For a better understanding of the relationship between the LEI and recessions, the next chart shows the percentage...

dshort Featured Charts
As the tone of my post suggests, I find this "ultimate" variant of the 50-200 day moving average -- nominal or rea...
2

dshort Featured Charts
Yes, the real (inflation-adjusted) version dropped us into the "Death Zone" twice since the inception of the S&P 5...

20120719_phillyjobs.png (720×383)
Hidden under the covers of this morning's already dismal headline print in the Philly Fed data was a considerably...

20120719_top.png (631×373)
Velocity of M2 money cycle - Velocity of M2 Money Stock (blue) and the S&P500 (red): Inversion in the velocity & S...
usaveragerates24may.jpg (642×328)

2012-07-18_1445 - chartwiz's library

2
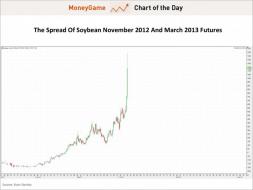
chart of the day, spread between soybean november 2012 and march...
Bonkers Soybean Spread

Bonkers Soybean Spread
CHART OF THE DAY: Soybean November 12 - March 13 Spreads - Business...
Bonkers Soybean Spread
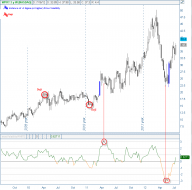
WPRT.png
Evening Tape for July 19 | SharePlanner

CORN after Resistance Touch.png
Turning Bullish on Solar

Large_yend9mv
SPX Credit Crises Analog 2007 v. 2010-12, Market Anthropology

CMG woW!.png
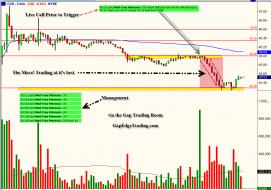
CVS Gap Down.jpg
CVS Gap Down Short


silversqueezejuly19.jpg (1576×730)
Silver chart from Kimble
CORN at Resistance.png
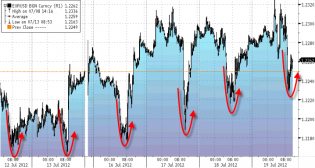
20120719_EUR.png (718×383)
For the sixth day-in-a-row, a rather interesting price action has occurred in the most liquid FX pair in the world...
Facebook FB
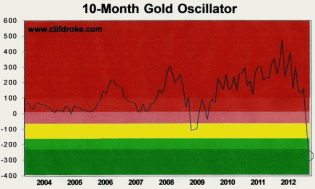
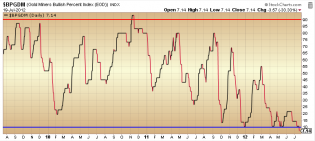
Gold Oscillator
gold is oversold

1
Click to View
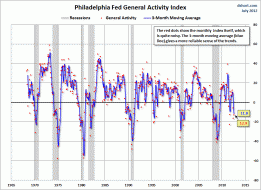
only once in the past 40 years has the Philly index been this low without the start of a recession
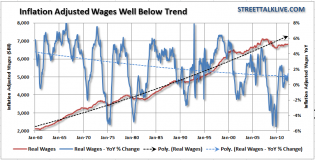
Corporate Profits Surge At Expense Of Workers
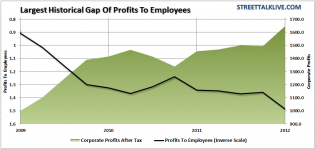
Corporate Profits Surge At Expense Of Workers
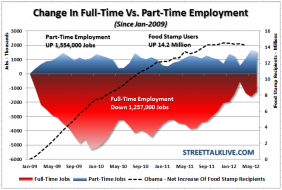
Corporate Profits Surge At Expense Of Workers
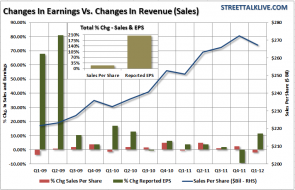
Corporate Profits Surge At Expense Of Workers
Mish's Global Economic Trend Analysis
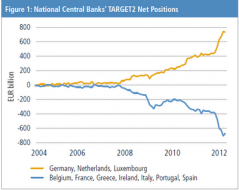
money shuffling in europe
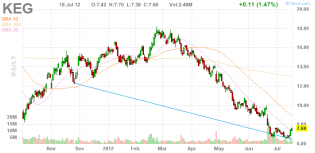
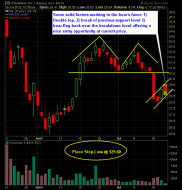
Stock Quote KEG
KEG has experienced a long decline and currently sits teasing the upper trendline ~ sell volume peaked at 5x avg o...